Tag: how to invest in real estate

  • The Future of Capital Markets Technology

    Capital Markets are where savings and investments are channeled between suppliers, people, or institutions with capital to lend or invest — as well as those in need (Hayes, Investopedia). Suppliers typically include banks and investors while those who seek capital are businesses, governments, and individuals. Capital markets are composed of primary and secondary markets.

    The most common capital markets are the stock market and the bond market. However other, more complex, markets include the CRE (Commercial Real Estate) Market, Equity Capital Market (ECM), as well as many others that are typically geared towards a specific investor. Therefore there is not as much trading volume or frequency, since the broader excitement is not the same. Even though real estate is the world’s largest asset class, we’ve seen a recent decline in CRE investment. Medium recently posted an article detailing the advantages of a platform called Beacon Platform, Inc, which was a critical, major acquisition for Centena.

    Medium: Modernizing the Capital Markets Technology Stack: Centana’s Investment in Beacon Platform, Inc.

    Why do customers choose Beacon?

    Time-to-Value and ROI. Today, companies continue to deal with cumbersome internal applications that have been stitched together, often with legacy code and/or 3rd party vendors in the Trading and Risk Management space, which are “black box” and difficult, if not impossible, to alter.

    Beacon’s entire code base is flexible and transparent (i.e. the code is made available to customers) and seamlessly integrates with existing software and other 3rd party solutions (like Murex and Calypso), or in-house proprietary solutions, which helps drive quick time-to-value and high utility.

    In a fraction of the time and cost of alternative solutions, Beacon has helped customers achieve objectives such as migrating workloads to the cloud, expanding into new markets, upgrading legacy code by placing it within a modern developer wrapper and extending analytics and applications to customers’ end-users.

    -Matt Alfieri
    Key Takeaways

    When it comes to capital markets technology, the evolving nature of the tech space all but ensures we will see new technologies introduced into capital markets operations. Additionally, while this may sound like an advertisement for Beacon (though FinYork has absolutely no affiliation to it), the critical feature to note is this is an exemplary illustration of where capital markets technology appears to be heading.

    Vertical SaaS or cloud industry solutions, instead of legacy or proprietary in-house solutions, are showing us that they’re easier to replace than many executives originally thought. You should expect to see a similar effect here as with PropTech, as it becomes more widely available and accepted by savvy executives and high net worth real estate investors. You definitely do not want to be the firm who is continuing to use antiquated capital markets technologies. This puts you at an immediate, huge disadvantage. It makes it that much harder to catch up with your competitors, who have a leg-up as they’ve already implemented innovative technologies.

    All this goes to say that SaaS, digital transformation, cloud technologies, PropTech, and even niche technologies that aim to improve efficiency in capital markets are going to play an integral part of the future. The success of firms who will adapt them largely depends on the success those firms will have in the implementation process. To be sure, capital markets technology is only going to continue getting more efficient, robust, and easier to adapt.
  • Key Players in the CRE Market

    Many property types within the Commercial Real Estate (CRE) market are generally agreed to have had a poor performance the past few years, largely due to the COVID-19 pandemic restrictions. Particularly, office and retail property types. The real question investors are asking themselves is whether or not it has the potential for an emphatic return, or if a commercial real estate focus is not likely to be a great long-term investing strategy. The opportunities for successful CRE investments are still there. There are still plenty of marketplaces exclusively geared towards CRE investment, which have uniquely positioned themselves in the broader real estate investing market.

    Before committing your resources to a given investment strategy, new investors should understand who the market players are for a CRE deal. Below is a thoroughly compiled list of the key players (roles) in the commercial real estate market, which then goes onto provide an additional link to a description of each role.

    Key Players in CRE :
    • Buyer & Seller
    • Brokers: Buy-side and Sell-side
    • Legal Counsel: Buy-side, Sell-side, and Lender Counsel
    • Mortgage Broker
    • Lender/Loan Officer
    • Title Company
    • Capital Partners/Investors
    • Property Management
    • Insurance Provider
    • Appraiser & Surveyor
    • Environmental Consultant
    • Accountant: Buy-side and Sell-side

    The following article shares a useful and detailed look at the key players in CRE. Refer to the link below. It provides key details about the key players in CRE’s marketplace.

    What Are The Key Players And What Are Their Roles In A Commercial Real Estate Transaction

    As a commercial real estate investor, either as a buyer or as a seller, you work with multiple parties to move a deal from discovery through to closing. To manage a deal process efficiently, it is of utmost importance to understand all of the key players in a commercial real estate transaction.

    GerCNergy.com (Administrator)
    https://getcnergy.com/knowledge-base/key-players-in-a-commercial-real-estate-transaction/
    Summary

    The above players all comprise parts of the CRE deal. It is important for a sophisticated investor to be familiar with the various players as they can understand the dynamics of a deal and align with the sponsors who will work with most of the players mentioned.

  • Key Players in the CRE Market

    Many property types within the Commercial Real Estate (CRE) market are generally agreed to have had a poor performance the past few years, largely due to the COVID-19 pandemic restrictions. Particularly, office and retail property types. The real question investors are asking themselves is whether or not it has the potential for an emphatic return, or if a commercial real estate focus is not likely to be a great long-term investing strategy. The opportunities for successful CRE investments are still there. There are still plenty of marketplaces exclusively geared towards CRE investment, which have uniquely positioned themselves in the broader real estate investing market.

    Before committing your resources to a given investment strategy, new investors should understand who the market players are for a CRE deal. Below is a thoroughly compiled list of the key players (roles) in the commercial real estate market, which then goes onto provide an additional link to a description of each role.

    Key Players in CRE :
    • Buyer & Seller
    • Brokers: Buy-side and Sell-side
    • Legal Counsel: Buy-side, Sell-side, and Lender Counsel
    • Mortgage Broker
    • Lender/Loan Officer
    • Title Company
    • Capital Partners/Investors
    • Property Management
    • Insurance Provider
    • Appraiser & Surveyor
    • Environmental Consultant
    • Accountant: Buy-side and Sell-side

    The following article shares a useful and detailed look at the key players in CRE. Refer to the link below. It provides key details about the key players in CRE’s marketplace.

    What Are The Key Players And What Are Their Roles In A Commercial Real Estate Transaction

    As a commercial real estate investor, either as a buyer or as a seller, you work with multiple parties to move a deal from discovery through to closing. To manage a deal process efficiently, it is of utmost importance to understand all of the key players in a commercial real estate transaction.

    GerCNergy.com (Administrator)
    https://getcnergy.com/knowledge-base/key-players-in-a-commercial-real-estate-transaction/
    Summary

    The above players all comprise parts of the CRE deal. It is important for a sophisticated investor to be familiar with the various players as they can understand the dynamics of a deal and align with the sponsors who will work with most of the players mentioned.

  • What’s Holding Back PropTech?

    While PropTech has seen some growth in recent years, more so before the COVID-19 pandemic, we still haven’t seen the manifestation of the scale of technological revolution in the property industry we were once promised. The vast majority of buildings we come across in our daily lives are still operating in traditional ways, using outdated but proven equipment. Let’s dive into why we are yet to see the kind of transformative innovation we were expecting on a broader scale.

    Real estate is widely recognized as the world’s largest financial asset class. However, in today’s world, we often see companies rise to prominence before crashing and burning in a matter of a few short years. Most of the biggest corporations in the world today didn’t have a trace of existence 30 years ago. The real estate asset class could not be categorized more differently. It’s not only the largest asset class (by far), it’s also the oldest asset class (Hagerty, Propmodo). Historically, the property industry is a very slow, cautious sector. Unlike an App, such as Uber for example, buildings and other construction projects take many years from the design process to the completion of the physical structure. This is attributed partially to the reality that protecting buildings and the occupants inside them is paramount. In both the residential and commercial real estate sub-sectors, moving too fast and making a mistake that may lead to a potential building collapse is simply out of the question. Due to real estate’s conservative business model, even the most sophisticated PropTech products are having a difficult time gaining broad, large-scale traction (Hagerty, Propmodo).

    Ernst & Young’s Comprehensive PropTech Study

    An Ernst & Young (E&Y) survey recently found that 43% of those who provide PropTech products are majorly struggling with widespread adoption across a given client’s business. Additionally, the same research discovered that 35% of PropTech providers are seeing a very sizable lack of scaling, as a direct result of their application being adopted. Perhaps the biggest shock from this study is 39% of respondents are yet to adopt even a single PropTech tool.

    In addition to safety concerns, the attitude of business managers has been noted as a key opponent to PropTech’s success. Value in real estate is most frequently determined by three factors: 1) location, 2) size, and 3) finishes [amenities]. Reducing costs and increasing efficiency plays a major role in the construction industry, but we don’t typically see those same levels of concern in asset management. PropTech is actually attempting to change that. With the right technology, savings from efficiency, integration, and automation can start to pile up (Hagerty, Propmodo). Having the ability to tap into data generated by buildings is providing actionable insights that are too big of a potential game-changer to ignore. For individuals or companies that already have a real estate strategy in place, implementing innovative PropTech is only putting them further ahead of the pack. Executives, board members, and direct real estate investors alike clearly understand the need for PropTech. The biggest challenge remains in implementation.

    Conclusions Drawn From Ernst & Young’s Study

    We can conclude from the E&Y study that the remedy starts with ensuring the right people are in place. E&Y found 53 percent of real estate owners don’t feel they have the in-house talent to successfully adopt new technology. It’s worth taking a moment to let that sink in. More than half of executives, or very senior personnel in a position to make these decisions, are not confident in their own teams’ implementation ability. Without technology-minded talent and leadership, it’s hard to see the light at the end of the tunnel. Traditional real estate leadership has often been hesitant – or perhaps more precisely, even negligent – in scrapping outdated systems and processes they’ve relied on for decades. Again, PropTech aims to alter that mindset entirely. Leveraging technology is about focusing on future potential, rather than cost. There are undoubtedly sizable upfront costs associated with widespread PropTech adoption across a portfolio. What makes executives and board members in particular hesitant with implementing PropTech is the mindset about their obligation to stakeholders being centered around cost cutting. Why bother spending money “fixing something” that isn’t broken? Buildings are operating just fine without the need for any sweeping, technological overhaul. That’s the position traditional real estate leadership has taken; they are extremely hesitant to tolerate large capital expenditures on risky, bold technologies that don’t have a clear trajectory of return on investment. Succinctly, from the E&Y analysis we can clearly deduce that executives and board members need to ensure there are enough personnel focused on technology to help senior management understand there in fact is a return on investment from implementing various PropTech products. It’s not as clear-cut, but the long-term financial benefits are there.

    Again, referring back to the same E&Y data, almost 60% of real estate companies surveyed responded that they find new systems difficult to integrate with existing platforms. This is viewed as a further hinderance for executives because this translates to times and resources in order to get things set up, further disincentivizing them by piling on additional costs and additionally clouding the potential return on investment. The rapid pace of development and deployment is leading to piecemeal technology strategies instead of full end-to-end solutions, which is easier for leadership to recognize. As the PropTech industry matures, consolidations, acquisitions, and a wider array of products to service every aspect of portfolios could help solve some of those problems (Hagerty, Propmodo).

    “As investors begin to see the benefit of companies adopting technology, we believe they will help drive the industry forward more rapidly in the same way that investor pressure has encouraged companies to do more and report more on ESG related issues”.

    Mark Grinis, Ernst & Young Global Real Estate, Hospitality, & Construction Leader

    Perhaps an unpopular opinion, but some have compelling arguments that growing pains in PropTech industry is actually a good thing. The real estate industry was stagnating for decades, perhaps centuries. In a few short years, technology has worked its way into practically every executive conversation or board member meeting. With that being said, retrofitting existing buildings will not be a viable solution for every – or most – property owners.  Building technology into the bedrock of the property industry is a ground-up exercise, literally, which makes taking stock of progress that’s been made that much more important. That’s where PropTech comes in. There’s plenty of obstacles in the industry slowing down PropTech at the moment, but there’s no stopping it, especially it in the long-term as we’ve seen companies rapidly expand cloud and digital transformation technologies.  

  • How big is the real estate sector in S&P 500?

    Commercial Real Estate (CRE) Investor Question #91: How big is the real estate sector in S&P 500?

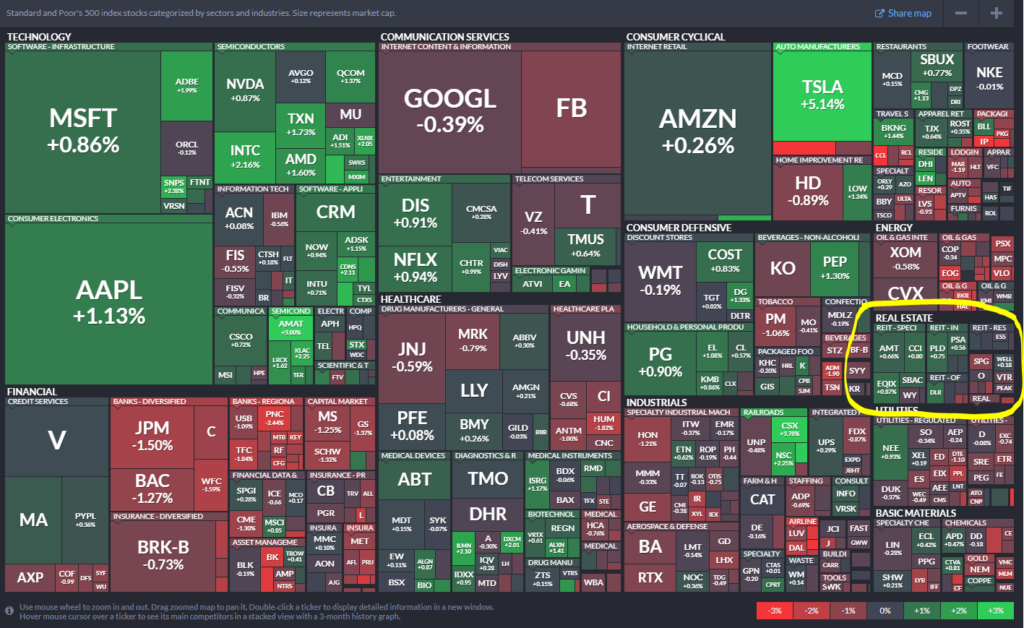
    The following illustration gives an idea of the size of the real estate sector (circled in yellow) within the S&P 500. Going by market size, it is one of the smallest sectors in S&P 500 as of March 2021. Technology is the biggest sector. The real estate sector consists of REITs across multiple property types like Industrial, Multifamily, Office, etc.

    Source: Finviz S&P 500 composition and the Real Estate sector
  • Can you leverage migration patterns for investing?

    Demographics and in particular net migration plays an outsized role in Real Estate. In this article, we’ll look at the key factors affecting real estate and why net migration is a good indicator to follow for real estate investors.

    We’ll delve into why net migration is actually a great indicator for the top states, counties, and towns to invest in. We’ll look at some migration reports from 2020 and see if they can form the basis of some investment ideas in 2021 and beyond.

    Key Pillars of Real Estate Investing

    Real Estate business and investing is impacted by multiple factors, but we can group them into three major categories:

    • Demographics
      • Population Growth, Urbanization/Sub-urbanization, and Migration
      • Employment Growth
      • Income/Cost of living
    • Economic
      • Supply & Demand
      • Infrastructure – Technology / Transportation
      • Fiscal and monetary policies (for e.g. interest rates)
    • Incentives
      • Affordable housing policies
      • Tax and Federal housing incentives
      • State and local incentives and policies

    For an individual investor, keeping track of the above can be overwhelming though some of the policies and economics may remain the same over years or even decades. Still, it is a stretch for individual investors. In this article, we’ll focus on demographics and see if net migration can be a proxy (or close to a proxy) to find states or cities to invest in.

    Demographics and demographic trends

    Our focus will be on demographics and in particular net migration in this article. Why is demographics a key pillar and why should we focus on that? Because demographics is all about the consumers i.e. tenants. One can have the best economic climate and the greatest policies, but at the end of the day a customer has to rent real estate and that is driven by demographics makeup. First, let us see the definition of demographics.

    Demographics are the data that describes the composition of a population, such as age, race, gender, income, migration patterns, and population growth. These statistics are an often overlooked but significant factor that affects how real estate is priced and what types of properties are in demand

    Source: https://www.investopedia.com/articles/mortages-real-estate/11/factors-affecting-real-estate-market.asp

    A customer (i.e. tenant) has to rent real estate in a given location and demographics is all about the customers. Investors should look at demographics at a given point of time as well as over a period of time (i.e. trends). It is also good to remember that many demographical trends were already underway and they only got accelerated due to the global pandemic in 2020.

    Net Migration and Migration Trends

    Investors realize that certain states or cities are growing because they see or hear about many moving to those places. For e.g. many people in New York realize that a lot of jobs are moving to the south, particularly Florida, and people follow those jobs. Net migration in certain regions, states, and cities surpass those of poorly faring places.

    Savills, the International real estate firm has done studies on the reasons for migration throughout the world. Here is the summary of the impact of migration on real estate.

    In-migration has a major impact on real estate as demand for both residential and commercial space increases. If supply is unable to match the demand, this often results in pressure on prices. We have analyzed data from Oxford Economics to understand which cities are expected to attract the largest net migration over the next five years as a percentage of their population.

    Source: https://www.savills.com/impacts/social-change/the-impact-of-migration-on-real-estate.html

    Savills has the following take on the reasons major cities are seeing a lot of net migration:

    • Europe: Swiss Cities in demand
    • Asia: Attracting talent
    • North America: Quality of life

    We’ll look at net migration data and statistics on the following factors in US and see if we see some patterns that will give some ideas on locations to invest.

    • Flight to suburbs and smaller cities
    • Flight to quality of life
    • Flight to “business” friendly and no-tax states

    Net migration to secondary cities and suburbs

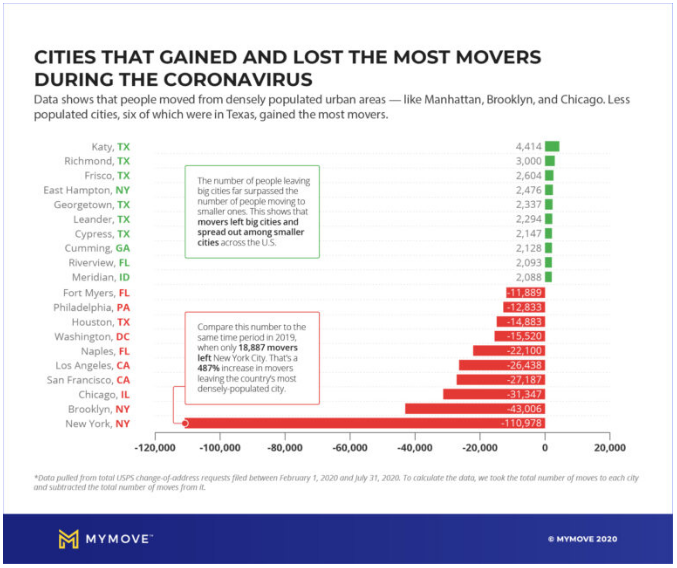
    Mymove has studied migration patterns in 2020 with the COVID pandemic and over 15.9 million have moved during the pandemic based on USPS data. Urban density has been a big reason for people to move to smaller cities and suburbs. As you can see from the chart below, big cities have had a large outflow in the first half of 2020. This has resulted in rent reduction in dense and pricey cities, but the opposite in smaller cities and suburban places.

    CITIES THAT GAINED AND LOST THE MOST MOVERS 
DURING THE CORONAVIRUS 
Data shows that people moved from sely populated urban areas — like Manhattan, Brooklyn. and Chicago. Less 
cities, six of which were in Texas, gained the most movers. 
Katy, TX 
Richmond, TX 
East Hampton. NY 
Leander, TX 
cypress. TX 
Cumming, GA 
Meridian. ID 
Myers. 
Philadelphia. PA 
Houston. 
TX 
Washington, DC 
Naples, 
FL 
LOS CA 
San Vrancisco. 
CA 
NY 
New York. 
-120n 
lett big cit•s 
cit*sacrcssmeUS 
20'9. 
18.887 —S 
lett ( 
2,476 
2,29a 
2,093 • 
20s* • 
20.000 
7070 
M MYMOVE-

    Net migration to “business” friendly or no-tax states

    In the 20th century, people migrated to cities like New York or Los Angeles for better opporunities, but in the past couple of decades states like Texas have been able to lure many people with their “business” friendly or no-tax policies. Florida and Arizona are also considered “business” and tax friendly states and hence the net migration needs to be reviewed further.

    STATES THAT GAINED AND LOST THE MOST MOVERS 
DURING THE CORONAVIRUS 
Florida , New York, and California — states with big cities that experienced a surge in infection rates during the onset 
of the pandemic — lost the largest number of movers. Michigan, North Carolina, and Texas the most movers. 
NJ 
HIGHEST NET GAIN 
-199,000 to 
S9,ocoto -go,ooo 
-79,000 to 40,000 
-39.000 to O 
M MYMOVE• 
to 10,ooo 
10,001 to 
20,001 to 30,000 
30,001 to 40,000 
40,001 to 50,000 
PR 
HIGHEST NET Loss 
-235.765 
-15.638 
MN 
TX 
NC 
30.603

    Net Migration for quality of life

    Quality of life is primarily defined by cost of living and access to amenities that people are looking for. Savills Research shows the top 10 cities for net migration in the US. The results should not be surprising for many. We see cities in Texas, Flordia and Georgia that have attracted sizable new population. This should give investors some ideas about places to invest.

    Source: Savills Research using Oxford Economics  Note: Only cities with GDP greater than $50bn considered

    Investor Takeaways

    In summary, we’ve seen how demographics is a key pillar of real estate investing. We’ve seen how net migration is a great indicator or proxy of demographics and even attractiveness of investment locations. We’ve also looked at migration patterns in US to help investors find states and cities that may be attractive investing targets.

    Though net migration data should not be looked at on its own, looking at migration along with other key data will net investors some good investment locations and ideas. The action items for investors are to answer the questions: Do the locations you want to invest in have these positive migration characteristics? Can you update your investment thesis based on these locations?

  • Can you leverage migration patterns for investing?

    Demographics and in particular net migration plays an outsized role in Real Estate. In this article, we’ll look at the key factors affecting real estate and why net migration is a good indicator to follow for real estate investors.

    We’ll delve into why net migration is actually a great indicator for the top states, counties, and towns to invest in. We’ll look at some migration reports from 2020 and see if they can form the basis of some investment ideas in 2021 and beyond.

    Key Pillars of Real Estate Investing

    Real Estate business and investing is impacted by multiple factors, but we can group them into three major categories:

    • Demographics
      • Population Growth, Urbanization/Sub-urbanization, and Migration
      • Employment Growth
      • Income/Cost of living
    • Economic
      • Supply & Demand
      • Infrastructure – Technology / Transportation
      • Fiscal and monetary policies (for e.g. interest rates)
    • Incentives
      • Affordable housing policies
      • Tax and Federal housing incentives
      • State and local incentives and policies

    For an individual investor, keeping track of the above can be overwhelming though some of the policies and economics may remain the same over years or even decades. Still, it is a stretch for individual investors. In this article, we’ll focus on demographics and see if net migration can be a proxy (or close to a proxy) to find states or cities to invest in.

    Demographics and demographic trends

    Our focus will be on demographics and in particular net migration in this article. Why is demographics a key pillar and why should we focus on that? Because demographics is all about the consumers i.e. tenants. One can have the best economic climate and the greatest policies, but at the end of the day a customer has to rent real estate and that is driven by demographics makeup. First, let us see the definition of demographics.

    Demographics are the data that describes the composition of a population, such as age, race, gender, income, migration patterns, and population growth. These statistics are an often overlooked but significant factor that affects how real estate is priced and what types of properties are in demand

    Source: https://www.investopedia.com/articles/mortages-real-estate/11/factors-affecting-real-estate-market.asp

    A customer (i.e. tenant) has to rent real estate in a given location and demographics is all about the customers. Investors should look at demographics at a given point of time as well as over a period of time (i.e. trends). It is also good to remember that many demographical trends were already underway and they only got accelerated due to the global pandemic in 2020.

    Net Migration and Migration Trends

    Investors realize that certain states or cities are growing because they see or hear about many moving to those places. For e.g. many people in New York realize that a lot of jobs are moving to the south, particularly Florida, and people follow those jobs. Net migration in certain regions, states, and cities surpass those of poorly faring places.

    Savills, the International real estate firm has done studies on the reasons for migration throughout the world. Here is the summary of the impact of migration on real estate.

    In-migration has a major impact on real estate as demand for both residential and commercial space increases. If supply is unable to match the demand, this often results in pressure on prices. We have analyzed data from Oxford Economics to understand which cities are expected to attract the largest net migration over the next five years as a percentage of their population.

    Source: https://www.savills.com/impacts/social-change/the-impact-of-migration-on-real-estate.html

    Savills has the following take on the reasons major cities are seeing a lot of net migration:

    • Europe: Swiss Cities in demand
    • Asia: Attracting talent
    • North America: Quality of life

    We’ll look at net migration data and statistics on the following factors in US and see if we see some patterns that will give some ideas on locations to invest.

    • Flight to suburbs and smaller cities
    • Flight to quality of life
    • Flight to “business” friendly and no-tax states

    Net migration to secondary cities and suburbs

    Mymove has studied migration patterns in 2020 with the COVID pandemic and over 15.9 million have moved during the pandemic based on USPS data. Urban density has been a big reason for people to move to smaller cities and suburbs. As you can see from the chart below, big cities have had a large outflow in the first half of 2020. This has resulted in rent reduction in dense and pricey cities, but the opposite in smaller cities and suburban places.

    CITIES THAT GAINED AND LOST THE MOST MOVERS 
DURING THE CORONAVIRUS 
Data shows that people moved from sely populated urban areas — like Manhattan, Brooklyn. and Chicago. Less 
cities, six of which were in Texas, gained the most movers. 
Katy, TX 
Richmond, TX 
East Hampton. NY 
Leander, TX 
cypress. TX 
Cumming, GA 
Meridian. ID 
Myers. 
Philadelphia. PA 
Houston. 
TX 
Washington, DC 
Naples, 
FL 
LOS CA 
San Vrancisco. 
CA 
NY 
New York. 
-120n 
lett big cit•s 
cit*sacrcssmeUS 
20'9. 
18.887 —S 
lett ( 
2,476 
2,29a 
2,093 • 
20s* • 
20.000 
7070 
M MYMOVE-

    Net migration to “business” friendly or no-tax states

    In the 20th century, people migrated to cities like New York or Los Angeles for better opporunities, but in the past couple of decades states like Texas have been able to lure many people with their “business” friendly or no-tax policies. Florida and Arizona are also considered “business” and tax friendly states and hence the net migration needs to be reviewed further.

    STATES THAT GAINED AND LOST THE MOST MOVERS 
DURING THE CORONAVIRUS 
Florida , New York, and California — states with big cities that experienced a surge in infection rates during the onset 
of the pandemic — lost the largest number of movers. Michigan, North Carolina, and Texas the most movers. 
NJ 
HIGHEST NET GAIN 
-199,000 to 
S9,ocoto -go,ooo 
-79,000 to 40,000 
-39.000 to O 
M MYMOVE• 
to 10,ooo 
10,001 to 
20,001 to 30,000 
30,001 to 40,000 
40,001 to 50,000 
PR 
HIGHEST NET Loss 
-235.765 
-15.638 
MN 
TX 
NC 
30.603

    Net Migration for quality of life

    Quality of life is primarily defined by cost of living and access to amenities that people are looking for. Savills Research shows the top 10 cities for net migration in the US. The results should not be surprising for many. We see cities in Texas, Flordia and Georgia that have attracted sizable new population. This should give investors some ideas about places to invest.

    Source: Savills Research using Oxford Economics  Note: Only cities with GDP greater than $50bn considered

    Investor Takeaways

    In summary, we’ve seen how demographics is a key pillar of real estate investing. We’ve seen how net migration is a great indicator or proxy of demographics and even attractiveness of investment locations. We’ve also looked at migration patterns in US to help investors find states and cities that may be attractive investing targets.

    Though net migration data should not be looked at on its own, looking at migration along with other key data will net investors some good investment locations and ideas. The action items for investors are to answer the questions: Do the locations you want to invest in have these positive migration characteristics? Can you update your investment thesis based on these locations?

  • Rental Yield vs. Cap Rate?

    Commercial Real Estate (CRE) Investor Question #90: What is the difference between rental yield and cap rate?

    Rental yield is the net amount of money a landlord receives in rent over one year (after deducting operating expenses), shown as a percentage of the amount of money invested in the property.

    So, Rental Yield = (Net Annual Rental Income / Cost) X 100

    Note that rental yield is calculated on Net Operating Income without considering interest payment, tax and depreciation.

    Cap rate (or capitalization rate) is the ratio between the net operating income produced by a real estate asset and its cost (or current market value).

    So, Cap Rate = Net Operating Income / Value (or cost)

    If you notice, both rental yield and cap rate appears to be same!

    Rental yield is used to calculate the yield (return) of an asset whereas the cap rate is used to find the value (capitalized value) of an income generating real estate asset.

    Source: https://www.feasibility.pro/real-estate-analyst-interview-questions-answers/
  • Rental Yield vs. Cap Rate?

    Commercial Real Estate (CRE) Investor Question #90: What is the difference between rental yield and cap rate?

    Rental yield is the net amount of money a landlord receives in rent over one year (after deducting operating expenses), shown as a percentage of the amount of money invested in the property.

    So, Rental Yield = (Net Annual Rental Income / Cost) X 100

    Note that rental yield is calculated on Net Operating Income without considering interest payment, tax and depreciation.

    Cap rate (or capitalization rate) is the ratio between the net operating income produced by a real estate asset and its cost (or current market value).

    So, Cap Rate = Net Operating Income / Value (or cost)

    If you notice, both rental yield and cap rate appears to be same!

    Rental yield is used to calculate the yield (return) of an asset whereas the cap rate is used to find the value (capitalized value) of an income generating real estate asset.

    Source: https://www.feasibility.pro/real-estate-analyst-interview-questions-answers/
  • Is real estate a good hedge against inflation?

    Commercial Real Estate (CRE) Investor Question #89: Is real estate / housing a good hedge against inflation?

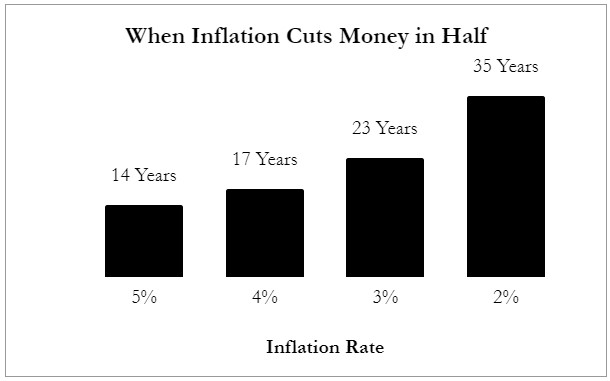
    Yes, real estate or housing is a good hedge against inflation. Ben Carlson, a popular portfolio manager has an in-depth article on this question. Here’s a picture from his book on how inflation “destroys” wealth. On the flip side, having a mortgage can help counteract those interest payments over time.

    Source: https://awealthofcommonsense.com/2021/03/why-housing-is-a-good-hedge-against-inflation/