Tag: real estate

  • Why the SEC will Ultimately Deny VanEck’s Third Application for a Bitcoin Spot ETF and What it Means for Digital Assets

    Late last month, August 2022, the SEC announced a 45-day delay to rule on VanEck’s third Bitcoin Spot ETF application. This comes on the heels of the SEC denying Grayscale’s GBTC – an SEC backed Bitcoin Trust – conversion to a spot ETF, as well as Bitwise Asset Management’s application for a spot ETF, on the same day in late June 2022. VanEck currently has an SEC-backed Bitcoin futures ETF, the “VanEck Bitcoin Strategy ETF” (Cboe: XBTF). Their two previous applications for a Bitcoin spot ETF were rejected first in 2017, then late in 2021. VanEck is considered somewhat of an “investment giant”, with roughly $65B currently in AUM.

    Grayscale, with roughly $20M in AUM and a digital asset manager giant themselves, a subsidiary of Digital Currency Group (DCG) – who’s also the parent company of CoinDesk – sued the SEC immediately after they rejected the GBTC’s conversion from a SEC-backed Bitcoin Trust to a SEC-backed spot ETF. A ruling from a Federal Appellate Court is expected sometime in Q4 2023 or Q1 2024.

    Why Will the SEC Reject VanEck’s Application for a Bitcoin Spot ETF a Third Time?

    A better way to phrase the question is: why wouldn’t they? Has anything dramatically changed about either the SEC’s mandates, Bitcoin, market conditions, or is VanEck’s application unique? No, for all the above. VanEck’s Bitcoin spot ETF, which they’ve proposed to list on the Cboe BZX Exchange, would still create direct Bitcoin ownership for investors who purchased it. In my opinion, the SEC’s had to issue a 45-day delay because VanEck’s argument appears to differ from Grayscale’s. VanEck isn’t relying on a futures versus spot Exchanged Traded Fund [ETF] derivative comparison. Rather, they’re urging the SEC to reconsider because investors can access Bitcoin spot ETFs through our neighbors in Canada.

    They’re not wrong. As early as February 2021, Canada became one of the first countries in the world to place a Bitcoin spot ETF on one of their national exchanges. But given that was back in February 2021, the question remains: what’s changed? It’s completely unrealistic for the SEC to admit they weren’t aware of a Bitcoin spot ETF on a Canadian exchange. Hypothetically, it would very likely give Grayscale the green light to pursue further, more substantial legal action against the SEC.

    At the time Grayscale’s GBTC was rejected, many analysts cited the heightened potential for fraud and malpractice amongst digital assets being a key reason institutional investors, who generally purchase far more spot products than futures derivatives (as part of their traditional investment strategies), should not get access to an SEC-backed Bitcoin spot ETF yet. They said digital currency exchanges needed total transparency inside their marketplaces, like the DOW and NASDAQ. While this flies in the face of many reasons investors purchase digital assets and it’s not practical, it didn’t matter. That’s what the institutional investor community who was with the SEC just two months back demanded. VanEck is not purely a digital asset manager like Grayscale and in terms of AUM, they’re over 3 times larger.

    As another interesting reference point VanEck currently has 3 CO (Commodity) ETFs. The first is XBFT (Bitcoin Strategy ETF) and the second is OUNZ (VanEck Merk Gold ETF). XBFT has $19.2M in total net assets, while OUNZ has $600.4M. Interestingly, VanEck offers 65 EFT products and only 3 fall in the Commodities Asset Class. The other 62 are split between Fixed Income (Corporate, International, & Municipal Bonds, Rates products, etc.) and Equity ETFs. VanEck’s GDX has $9.4B in total net assets, while their ITM has 1,939 holdings (September 2, 2022). The XBFT has just $19.2M in total net assets and only 8 people holding it (September 2, 2022). Of the roughly $65B VanEck has in AUM, XBFT – a Bitcoin futures ETF – represents around .002% of their investment portfolio.

    Concisely, VanEck is a bigger, more established firm that has broader appeal to institutional investors already compared to Grayscale, who owns roughly 3.5% of all of Bitcoin and is purely a digital asset manager. They have the first SEC-approved Bitcoin Trust ETF with GBTC, trading on the NASDAQ. They are doing their best to bring digital assets to institutional investors. That’s why they’ve gone all out for a Bitcoin spot ETF, whereas VanEck seems to have strategically made a push when they’ve felt they had a compelling case.

    Does the SEC’s 45-Delay Mean VanEck has a Real Chance?

    I believe it means they have a better chance, but will ultimately suffer the same fate as Grayscale and Bitwise. I don’t even think it gives them much of a better chance; only if the SEC makes an unexpected blunder. Nothing has changed about their concerns related to GBTC that would warrant VanEck’s application to get approved.

    “The Commission [SEC] finds that it is appropriate to designate a longer period within which to take action on the proposed rule change so that it has sufficient time to consider the proposed rule change and the issues raised therein.”
    -SEC Spokesperson, in a letter to VanEck (August 2022)
    Tweet

    The verbiage in this quote seems to be hinting that the SEC is actually considering accepting VanEck’s argument. However, the SEC issuing a delay on a ruling isn’t exactly breaking news. They’ve shot down over a dozen attempts at a Bitcoin spot ETF in the last 12-month calendar year alone. There is no new information to indicate Bitcoin is any less susceptible to fraud – thereby posting inherent investor risk – than two months ago. The SEC is buying time in hopes of making a more compelling case regarding Bitcoin spot ETF’s in Canadian markets. What’s going to make more headlines in 45 days, the macroeconomic conditions from rising rates, inflation, and other recessionary indicators, or the SEC rejected the 15th (or so) Bitcoin spot ETF in the last year? After all, the SEC isn’t completely unaware of the current dynamics in financial markets.

    If VanEck is Ultimately Denied, What Does that Mean for Cryptocurrency?

    The overall impact is unlikely to be large, unless the SEC gets unpredictable here. Assuming they stay consistent with their rationale, this matter will go back to the DC Appellate Courts. But if you’re an institutional investor of SEC-approved Bitcoin assets, you’re not going to be majorly impacted by this. Inflation and rising interest rates? That will likely negatively impact at risk assets across the board and digital assets are certainly in that category. But the long-term ramifications for Bitcoin from this latest SEC ruling are likely to be very minimal.

    Just to end with a key point we just touched on, watch out for at risk assets considering this is very likely going to be the realest felt recession since 2008. There won’t be a major economic downturn because we’ve learned our lessons from 2008, but investors will sell off at-risk assets as soon as financial markets show signs of destabilization. Digital assets in an investor’s portfolio will be one of the first to go. Combined with the seasonality of Bitcoin slumps, expect the price to drop below 15,000 and who knows how much lower. How much lower would it take for the strongest crypto asset enthusiasts to wave the red flag? Would that ever happen? Only time will tell, but again, considering we have a lot of indications a recession is coming, taking a bullish position on Bitcoin in the short-term is unwise at best.

  • Why the SEC will Ultimately Deny VanEck’s Third Application for a Bitcoin Spot ETF and What it Means for Digital Assets

    Late last month, August 2022, the SEC announced a 45-day delay to rule on VanEck’s third Bitcoin Spot ETF application. This comes on the heels of the SEC denying Grayscale’s GBTC – an SEC backed Bitcoin Trust – conversion to a spot ETF, as well as Bitwise Asset Management’s application for a spot ETF, on the same day in late June 2022. VanEck currently has an SEC-backed Bitcoin futures ETF, the “VanEck Bitcoin Strategy ETF” (Cboe: XBTF). Their two previous applications for a Bitcoin spot ETF were rejected first in 2017, then late in 2021. VanEck is considered somewhat of an “investment giant”, with roughly $65B currently in AUM.

    Grayscale, with roughly $20M in AUM and a digital asset manager giant themselves, a subsidiary of Digital Currency Group (DCG) – who’s also the parent company of CoinDesk – sued the SEC immediately after they rejected the GBTC’s conversion from a SEC-backed Bitcoin Trust to a SEC-backed spot ETF. A ruling from a Federal Appellate Court is expected sometime in Q4 2023 or Q1 2024.

    Why Will the SEC Reject VanEck’s Application for a Bitcoin Spot ETF a Third Time?

    A better way to phrase the question is: why wouldn’t they? Has anything dramatically changed about either the SEC’s mandates, Bitcoin, market conditions, or is VanEck’s application unique? No, for all the above. VanEck’s Bitcoin spot ETF, which they’ve proposed to list on the Cboe BZX Exchange, would still create direct Bitcoin ownership for investors who purchased it. In my opinion, the SEC’s had to issue a 45-day delay because VanEck’s argument appears to differ from Grayscale’s. VanEck isn’t relying on a futures versus spot Exchanged Traded Fund [ETF] derivative comparison. Rather, they’re urging the SEC to reconsider because investors can access Bitcoin spot ETFs through our neighbors in Canada.

    They’re not wrong. As early as February 2021, Canada became one of the first countries in the world to place a Bitcoin spot ETF on one of their national exchanges. But given that was back in February 2021, the question remains: what’s changed? It’s completely unrealistic for the SEC to admit they weren’t aware of a Bitcoin spot ETF on a Canadian exchange. Hypothetically, it would very likely give Grayscale the green light to pursue further, more substantial legal action against the SEC.

    At the time Grayscale’s GBTC was rejected, many analysts cited the heightened potential for fraud and malpractice amongst digital assets being a key reason institutional investors, who generally purchase far more spot products than futures derivatives (as part of their traditional investment strategies), should not get access to an SEC-backed Bitcoin spot ETF yet. They said digital currency exchanges needed total transparency inside their marketplaces, like the DOW and NASDAQ. While this flies in the face of many reasons investors purchase digital assets and it’s not practical, it didn’t matter. That’s what the institutional investor community who was with the SEC just two months back demanded. VanEck is not purely a digital asset manager like Grayscale and in terms of AUM, they’re over 3 times larger.

    As another interesting reference point VanEck currently has 3 CO (Commodity) ETFs. The first is XBFT (Bitcoin Strategy ETF) and the second is OUNZ (VanEck Merk Gold ETF). XBFT has $19.2M in total net assets, while OUNZ has $600.4M. Interestingly, VanEck offers 65 EFT products and only 3 fall in the Commodities Asset Class. The other 62 are split between Fixed Income (Corporate, International, & Municipal Bonds, Rates products, etc.) and Equity ETFs. VanEck’s GDX has $9.4B in total net assets, while their ITM has 1,939 holdings (September 2, 2022). The XBFT has just $19.2M in total net assets and only 8 people holding it (September 2, 2022). Of the roughly $65B VanEck has in AUM, XBFT – a Bitcoin futures ETF – represents around .002% of their investment portfolio.

    Concisely, VanEck is a bigger, more established firm that has broader appeal to institutional investors already compared to Grayscale, who owns roughly 3.5% of all of Bitcoin and is purely a digital asset manager. They have the first SEC-approved Bitcoin Trust ETF with GBTC, trading on the NASDAQ. They are doing their best to bring digital assets to institutional investors. That’s why they’ve gone all out for a Bitcoin spot ETF, whereas VanEck seems to have strategically made a push when they’ve felt they had a compelling case.

    Does the SEC’s 45-Delay Mean VanEck has a Real Chance?

    I believe it means they have a better chance, but will ultimately suffer the same fate as Grayscale and Bitwise. I don’t even think it gives them much of a better chance; only if the SEC makes an unexpected blunder. Nothing has changed about their concerns related to GBTC that would warrant VanEck’s application to get approved.

    “The Commission [SEC] finds that it is appropriate to designate a longer period within which to take action on the proposed rule change so that it has sufficient time to consider the proposed rule change and the issues raised therein.”
    -SEC Spokesperson, in a letter to VanEck (August 2022)
    Tweet

    The verbiage in this quote seems to be hinting that the SEC is actually considering accepting VanEck’s argument. However, the SEC issuing a delay on a ruling isn’t exactly breaking news. They’ve shot down over a dozen attempts at a Bitcoin spot ETF in the last 12-month calendar year alone. There is no new information to indicate Bitcoin is any less susceptible to fraud – thereby posting inherent investor risk – than two months ago. The SEC is buying time in hopes of making a more compelling case regarding Bitcoin spot ETF’s in Canadian markets. What’s going to make more headlines in 45 days, the macroeconomic conditions from rising rates, inflation, and other recessionary indicators, or the SEC rejected the 15th (or so) Bitcoin spot ETF in the last year? After all, the SEC isn’t completely unaware of the current dynamics in financial markets.

    If VanEck is Ultimately Denied, What Does that Mean for Cryptocurrency?

    The overall impact is unlikely to be large, unless the SEC gets unpredictable here. Assuming they stay consistent with their rationale, this matter will go back to the DC Appellate Courts. But if you’re an institutional investor of SEC-approved Bitcoin assets, you’re not going to be majorly impacted by this. Inflation and rising interest rates? That will likely negatively impact at risk assets across the board and digital assets are certainly in that category. But the long-term ramifications for Bitcoin from this latest SEC ruling are likely to be very minimal.

    Just to end with a key point we just touched on, watch out for at risk assets considering this is very likely going to be the realest felt recession since 2008. There won’t be a major economic downturn because we’ve learned our lessons from 2008, but investors will sell off at-risk assets as soon as financial markets show signs of destabilization. Digital assets in an investor’s portfolio will be one of the first to go. Combined with the seasonality of Bitcoin slumps, expect the price to drop below 15,000 and who knows how much lower. How much lower would it take for the strongest crypto asset enthusiasts to wave the red flag? Would that ever happen? Only time will tell, but again, considering we have a lot of indications a recession is coming, taking a bullish position on Bitcoin in the short-term is unwise at best.

  • How CRE Investors Can Still Create Value Amidst Rising Rates

    As we’ve covered in the last couple weeks, the current trend seems to be moving towards the buyer’s direction. Rising rates and other consequences from inflation are certainly a motivating factor. However, that does not mean there is no room for the average investor to make money. This is particularly true for CRE (Commercial Real Estate) investors. There’s always money to be made in the real estate market, that is, if you’re a seasoned and skilled buyer.

    “You can’t add value to bonds — and unless you own a VC firm or you’re Warren Buffett or Elon Musk, you really can’t create value by owning stocks. Other than owning a company or a franchise, only real estate allows investors to roll up their sleeves, either physically or metaphorically, and create value in an investment.”
    -John Chang, Marcus & Millichap
    Tweet

    Not only that, but in the CRE marketplace specifically, investors have so many options. From REITs, REIGs, non-traded REIT sponsors, mini-tender offers, all the way to even direct CRE property management. The latter is what Chang illuded to in his quote above. Having a “do it yourself” attitude in real estate can allow to you avoid hiring FTE’s. Thus, you’re much more likely to have room for a positive return. What will every intelligent macroeconomist suggest to businesses when monetary policy is geared towards inflationary times, or a potential recession? Minimize business costs (Wan, CloserIQ). That applies directly to CRE investors too. If you can minimize your business cost, by acting as your own property manager for example, you are undoubtably more likely to succeed irrespective of turbulent financial times.

    With an official from the Fed quoted as saying he sees the Fed raising rates through the end of 2023, investors should prepare for a tightening economy (Saphir & Dunsmuir, Reuters). Rising prices with relatively unchanged labor market conditions. If you invest in FX, that likely means the dollar will be disadvantaged. But in CRE, as in the whole real estate asset class, positive returns are always on the table. To reiterate, investors who are willing to cut costs will make out well in a recessionary economic period.

  • Is India’s UPI (Unified Payments Interface) Technology Worth Selling Overseas and to Western Countries?

    The Unified Payments Interface (UPI) was created by the National Payments Corporation of India (NPCI) for purposes of “enabling digital payments and settlement systems in India, is an initiative of RBI and IBA”. As announced in Bloomberg in June 2022, the NPCI is looking to take UPI to overseas markets. This implies that a) the technology has been tested thoroughly and successfully in Indian markets and b) there is currently no real competitor to UPI in overseas markets. At one point, NPCI CEO Ritesh Shukla compared it to a “home-grown alternative to SWIFT”. For those who aren’t familiar, SWIFT is a Belgium-based cross-border payments system operator.

    Has the Product [UPI] been Thoroughly Tested in Indian Markets?

    Based on our research, yes UPI has been tested both rigorously and successfully in Indian markets.

    “We have displaced cash in India to a large extent and are now looking to repeat the success in cross-border corridors. Overseas Indians can use our rails to remit money inwards straightway into their bank accounts, and for the markets where Indians travel frequently, we will build acceptance for our instruments.”
    – NPCI CEO, Ritesh Shukla
    Tweet

    Not only has the technology behind UPI been proven and tested, but the methodology has also succeeded. At least that’s the quantitative claim Shukla’s making. The World Bank data seems to support the analysis too. Indians overseas remitted $87 billion in 2021; the biggest inflow for any country that was tracked by the World Bank.

    Under the RBI’s “Liberalized Remittance Scheme”, all resident individuals (including minors) are allowed to freely remit up to USD $250,000 per year. This is from April-March, for any permissible current or capital account transaction, or a combination of both. Further, resident individuals can avail of the foreign exchange facility, for specific purposes within the limit of USD $250,000 only. The RBI’s “Scheme” was introduced on February 4, 2004, with a limit of USD $25,000 (BusinessDesk, Bloomberg). Since then, the LRS limit has been revised in stages consistent with prevailing macro and micro economic conditions. Notably, the “Scheme” is not available to corporates, partnership firms, HUF, Trusts etc.

    Are there Any Notable Comparisons to India’s UPI Abroad (not factoring in SWIFT)?

    Of the $87 million in remittances India received in 2021, the US was the biggest source (World Bank). According to the World Bank, US remittances to India accounted for over 20% of the $87 million in 2021.

    “Flows to India (the world’s largest recipient of remittances) are expected to reach $87 billion, a gain of 4.6 per cent with the severity of COVID-19 caseloads and deaths during the second quarter (well above the global average) playing a prominent role in drawing altruistic flows (including for the purchase of oxygen tanks) to the country”.
    – World Bank Spokesperson, World Bank Migration and Development Brief, 2022
    Tweet

    In terms of total global remittances, India is followed by China, Mexico, the Philippines, and Egypt (World Bank). In India, remittances are projected to grow 3% in 2022 to $89.6 billion. This is reflective of a drop in overall migrant stock, as a large proportion of returnees from Middle Eastern countries are still awaiting return (World Bank).

    Remittances in low-and-middle-income countries are projected to have grown a strong 7.3% to reach $589 billion in 2021 (World Bank). This “return to growth” is far more robust than earlier estimates. Following the same resilience of flows in 2020, when remittances declined by only 1.7% despite a severe global recession due to COVID-19, according to estimates from the World Bank’s Migration and Development Brief. Lastly, the brief in its entirety can be found here, from the World Bank’s website.

    Outside of evaluating the micro-differences to SWIFT, there are no current notable competitors to India’s UPI we could find. Without any doubt, no possible comparisons would come close in terms of size or scale.

  • Is India’s UPI (Unified Payments Interface) Technology Worth Selling Overseas and to Western Countries?

    The Unified Payments Interface (UPI) was created by the National Payments Corporation of India (NPCI) for purposes of “enabling digital payments and settlement systems in India, is an initiative of RBI and IBA”. As announced in Bloomberg in June 2022, the NPCI is looking to take UPI to overseas markets. This implies that a) the technology has been tested thoroughly and successfully in Indian markets and b) there is currently no real competitor to UPI in overseas markets. At one point, NPCI CEO Ritesh Shukla compared it to a “home-grown alternative to SWIFT”. For those who aren’t familiar, SWIFT is a Belgium-based cross-border payments system operator.

    Has the Product [UPI] been Thoroughly Tested in Indian Markets?

    Based on our research, yes UPI has been tested both rigorously and successfully in Indian markets.

    “We have displaced cash in India to a large extent and are now looking to repeat the success in cross-border corridors. Overseas Indians can use our rails to remit money inwards straightway into their bank accounts, and for the markets where Indians travel frequently, we will build acceptance for our instruments.”
    – NPCI CEO, Ritesh Shukla
    Tweet

    Not only has the technology behind UPI been proven and tested, but the methodology has also succeeded. At least that’s the quantitative claim Shukla’s making. The World Bank data seems to support the analysis too. Indians overseas remitted $87 billion in 2021; the biggest inflow for any country that was tracked by the World Bank.

    Under the RBI’s “Liberalized Remittance Scheme”, all resident individuals (including minors) are allowed to freely remit up to USD $250,000 per year. This is from April-March, for any permissible current or capital account transaction, or a combination of both. Further, resident individuals can avail of the foreign exchange facility, for specific purposes within the limit of USD $250,000 only. The RBI’s “Scheme” was introduced on February 4, 2004, with a limit of USD $25,000 (BusinessDesk, Bloomberg). Since then, the LRS limit has been revised in stages consistent with prevailing macro and micro economic conditions. Notably, the “Scheme” is not available to corporates, partnership firms, HUF, Trusts etc.

    Are there Any Notable Comparisons to India’s UPI Abroad (not factoring in SWIFT)?

    Of the $87 million in remittances India received in 2021, the US was the biggest source (World Bank). According to the World Bank, US remittances to India accounted for over 20% of the $87 million in 2021.

    “Flows to India (the world’s largest recipient of remittances) are expected to reach $87 billion, a gain of 4.6 per cent with the severity of COVID-19 caseloads and deaths during the second quarter (well above the global average) playing a prominent role in drawing altruistic flows (including for the purchase of oxygen tanks) to the country”.
    – World Bank Spokesperson, World Bank Migration and Development Brief, 2022
    Tweet

    In terms of total global remittances, India is followed by China, Mexico, the Philippines, and Egypt (World Bank). In India, remittances are projected to grow 3% in 2022 to $89.6 billion. This is reflective of a drop in overall migrant stock, as a large proportion of returnees from Middle Eastern countries are still awaiting return (World Bank).

    Remittances in low-and-middle-income countries are projected to have grown a strong 7.3% to reach $589 billion in 2021 (World Bank). This “return to growth” is far more robust than earlier estimates. Following the same resilience of flows in 2020, when remittances declined by only 1.7% despite a severe global recession due to COVID-19, according to estimates from the World Bank’s Migration and Development Brief. Lastly, the brief in its entirety can be found here, from the World Bank’s website.

    Outside of evaluating the micro-differences to SWIFT, there are no current notable competitors to India’s UPI we could find. Without any doubt, no possible comparisons would come close in terms of size or scale.

  • Is there a Difference Between a ‘Buyer’s Market’ and a ‘Market that’s Rapidly Getting Less Advantageous Towards Seller’s’?

    The vast majority of latest prognostications point to a shift in the housing market, in favor of buyers over sellers. It’s about time. America’s housing market has been brutal on homebuyer’s, renters, and those looking to lease in prime locations for years now. There is a lot of qualitative and quantitative analysis to suggest that despite rising rates, buyers currently have the advantage.

    Realtor’s Weekly Housing Market: “The Four Big Bellwethers”

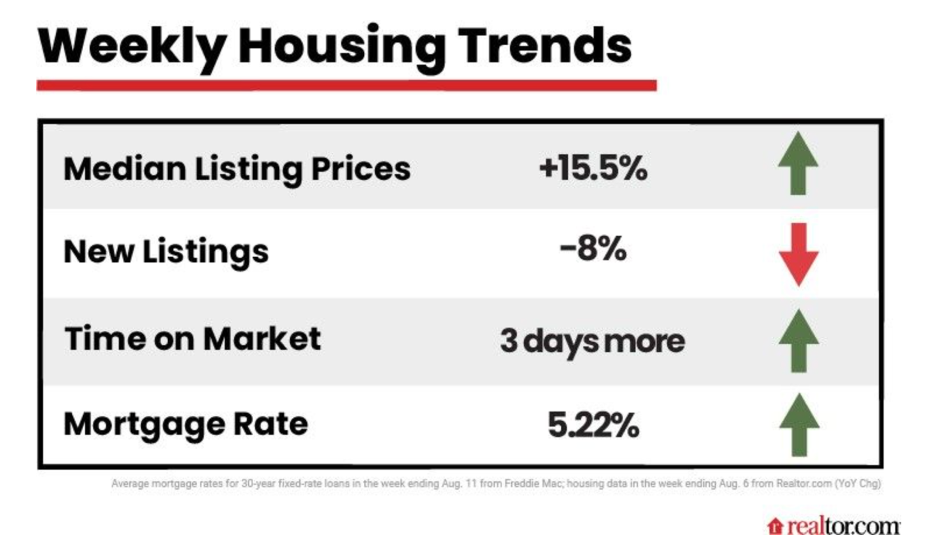
    Realtor has a weekly column called “How’s the Housing Market This Week?”. Realtor’s real estate economists are some of the most trusted in the industry. Weekly, Realtor delivers the most up-to-date statistics on what they coined “the four big bellwethers of the housing market”. These include home prices, # of new listings, total days on market, and of course, mortgage rates (Dutton, Realtor).

    “The housing market is resetting in a buyer-friendly direction,” notes Realtor Chief Economist Danielle Hale in her evaluation. We’d be remised if we didn’t note a “buyer-friendly direction” is certainly not the same as a true buyer’s market. While the same analysis notes the obvious, historic seller’s market that’s raged since COVID-19 began, it points out that the window for sellers is closing, rapidly. Below are the previously mentioned Realtor weekly housing trends, for week-end August 6th, 2022.

    -Realtor.com – Weekly Housing Trends, August 6th, 2022

    What jumps out to me are the top two statistics. A 15.5% median listing price increase, coupled with 8% fewer listing than the week before (Realtor.com). Hale has a unique and thought-provoking perspective on this phenomenon.

    Is There Surprisingly Good News in a 15.5% Increase in Median Listing Price?

    According to Hale, yes, this number is good news for prospective buyers. The last data from July 2022 shows a median nationwide listing price of $449,000. For the week ending August 6th, a 15.5% listing price increase means the new median was $518.595. While this marks the 34th straight week of double-digit price growth, Hale points out it’s also the “second consecutive week of deceleration” (Dutton, Realtor). The previous two weeks – at the end of July 2022 – median listing prices rose by 16.6% and 15.6%, respectively. This third ‘relatively temperate’ hike offers buyers hope home price growth will finally continue steadily dwindling.

    “The improvement has been substantial”, confirms Hale. She’s just as quick to add, “buyers in today’s market may still face meaningful affordability challenges as the typical home listing price remains near a record high”. But there’s little long-term evidence to suggest sticker price is a major deterrent for buyers (Dutton, Realtor). Hale reaffirms, “Persistent [homebuyers] may still continue to find success”. She goes on to add, “Second quarter data showed that homeownership rates increased from a year ago, both overall and for nearly every age and racial and ethnic group”.

    Given that homeownership rates have surged — amid rampant inflation, rising mortgage rates, and other deterrents — strongly signals that buyers who are willing to have some flexibility will ultimately win. Participants who are been willing to purchase somewhere they may not have considered pre-pandemic have largely become homebuyers. It’s a true testament to the lengths that homebuyers are willing to go today, provided sellers meet them halfway.

    Are Sellers Undermining the ‘Buyer Friendly’ Market?

    Anything positive for homebuyers is a negative for home sellers and of course, vice versa. Many sellers with properties on the market are panicking they ‘missed the mark’ by not closing a sale on their property during the COVID-19 real estate boom. For week-end July 30th, 2022, the number of new listings dropped by 8%, year-over-year (Dutton, Realtor).

    “New listings fell from a year ago for a fourth week. This is looking more and more like sellers may be wary of current market conditions, which have shifted substantially, even though they remain quite favorable to sellers who have owned for just about any length of time.”

    – Danielle Hale, Chief Economist, Realtor

    Hale appears to be hesitant to commit to buyer-friendly market conditions. However, she does definitively comment that conditions are becoming less and less favorable for sellers. The same message seems to be resonating across the board: if you’re a seller, the longer your property stays on the market, the worse-off your position will be.

    “While overall inventory [of new and old listings] grew by 28% over this same week last year, the active listings count still trails its 2020 and 2019 levels by more than 15% and 45%, respectively. More improvement in active inventory is likely needed to bring balance, but the recent trend may be at risk if homeowner attitudes toward selling now continue to deteriorate.”

    – Danielle Hale, Chief Economist, Realtor

    Once again, Hale seems to reemphasize the same underlying position. ‘We’re not in a pro-buyer’s market, we’re in a market that’s rapidly growing less favorable to sellers.’

    Are Rising Mortgage Rates to Blame for Homebuyers not Rushing to Close a Deal?

    The last question Realtor’s frequented market assessment addresses is why buyer’s aren’t rushing to close the deal. We are in a market that’s getting less and less favorable towards sellers, after all. What happens when we hit that market floor and conditions start to change against homebuyers. That has been the case – at a staggering rate – for well over two years now (Dutton, Realtor).

    In July 2022, listings lingered on the market a mere 34 days before getting snapped up. That’s nearly half the time it took two years earlier (Dutton, Realtor). Conversely, after having entered August 2022, it seems homebuyers are pumping the breaks and not feeling in such a rush. Hale’s prediction? Expect more of the same. She stated, “We expect more slowing ahead as the housing market reset”. The question remains, why?

    According to data provided by Freddie Mac, rising mortgage rates are a good place to start. For week-end August 11th, 2022, the average 30-year fixed mortgage rate increased to 5.22%. That’s considered a significantly steep spike from the previous week’s 4.99% (Mortgage Rates, Freddie Mac). Realtor predicts the future will hinge on how large corporations will view the potentially looming recession.

    “The big question for consumers is whether companies will over-react to the recession concerns and start trimming payrolls. A sharp pullback in hiring could have a direct impact on people’s ability to keep spending, especially with today’s high inflation.”

    – George Ratiu, Senior Economist, Realtor

    Realtor ultimately winds up agreeing. Prospective homebuyers should take full advantage of this buyer-friendly market while it lasts (Dutton, Realtor).

  • Is the US Real Estate Market Finally Starting to Cool Off?

    According to recent trends witnessed primarily in California, but largely nationwide, the supply in the housing market appears to be growing, while the demand is shrinking. This is what experts are counting on leading to a “cool off” period in real estate prices. “Today, week after week, we see more and more inventory come on the market and demand is down,” said broker Justin Itzen. He added, “Buyers have more to choose from, they can be more selective” (Moscufo, ABC News). Taylor Marr, chief economist of Redfin, echoed a very similar narrative. Marr made a distinguishment between expensive coastal markets and cheaper, rural housing markets. As Itzen’s remarks indicated, Marr concurs coastal cities located in California, New York, etc. will witness most of the impact.

    But that still leaves the larger question unanswered; are we looking at a nationwide real estate cooling period? According to an investors report Redfin released at the very start of August 2022, the share of home listings that have been on the market for more than 30 days has increased more than 12% from 2021. Due to inflationary effects, interest rates for average mortgages were between 5-6% in July 2022, compared to 2-3% July 2021. Inflation and rising prices (or rates) go hand-in-hand, but this increase is steep enough to leave tangible impressions. With more listings, dropping prices, and definite near future housing market uncertainty, we’re hopefully finally entering a buyer’s market.

    Importantly, Iesha McTier-Whyte, a broker selling middle to high-end homes in Newark, NJ advised she’s seen the same pattern. However, she doesn’t view it as a bad thing. “It’s nice to see [the market] cool down and kind of go back to the basics,” McTier-Whyte said. “What we experienced last year was like no other”. Itzen’s partner, Gio Helou, remarked “buyers are [now] able to actually go through the natural home buying process”. Assumingely, Helou meant that buyer’s now have the luxury of options. They no longer have to make the same kind of extraordinary sacrifices to simply purchase a family home.

    At one point, “homes were going within days for way over the asking price,” said Tim Sherman, a prospective homebuyer. When he and his wife found a home in Huntington Beach, CA, they began considering liquidating investments to purchase it. Not only “15% over the asking price,” commented Sherman, “but it was now over the market estimates of what the property was worth” (Moscufo, ABC News).

    The end to Sherman’s story really ties into the underlying assertion of this article. That first house fell through, but he and his wife did wind up purchasing a home. As soon as they saw the photos their broker sent them, they put in an immediate offer. Their former home in Dallas then sold in just one day (Moscufo, ABC News). If that’s any indication of the market dynamics moving forward, expect lower prices, more supply, and increased quality listings. A true win-win, both for individual homeowners and for real estate investors. As for the critics who continue to say there’s somewhat of a 2008-like “housing bubble” getting ready to pop, there’s little quantitative evidence to support the theory. Yet even the critics concede:

    “There is now a huge supply of new houses for sale, in all stages of construction, over 9 months’ supply in total, according to the Census Bureau. In terms of the number of houses, by June [2022], there were 463,000 new single-family houses at all stages of construction for sale, the highest since May 2008, and up by over 30%, from a year ago.”

    -Wolf Richter, The Wolf Street Report

    Their perspective is investors need to remain patient, as market conditions are continuing to return to their equilibrium. After what we’ve witnessed with the COVID-19 global pandemic, anything is possible, but conceptually, our economy isn’t close to the same state it was in heading into the 2008 financial collapse. We have far more restrictions on speculative investments, strict leverage ratios, mandatory reporting requirements, etc. The lessons of 2008 essentially taught us how to avoid widespread economic fragility when a significant market starts looking vulnerable. Additionally, the credit worthiness, financial disclosures, and ability to repay have all tightened considerably for buyers. Time will only tell whether we are in the midst of a “cooling off” period, or if we’re about to witness about bubble bursting. From our research and observations, we see it as more of a buyer’s market than a ‘fragile’ housing market.  

  • Are CRE Investors Impacting Environmental Social Governance (ESG)?

    Many experts are confirming the number of commercial real estate (CRE) investors who are considering environmental, social, and governance (ESG) standards when looking at potential investment opportunities is significantly increasing. A staggering 60 percent of respondents to brokerage CBRE’s 2021 Global Investor Intentions Survey stated that they had already adopted ESG criteria as part of their investment strategies. In other words, 3 out of every 5 CRE investors have factored ESG into their investment portfolio’s strategy. That’s an extremely significant number.

    What’s The Impact?

    This will force real estate investment firms to start catering to ESG conscious investors if they want to remain competitive. According to the same 2021 CBRE report, some CRE firms have committed to net-zero carbon emissions: Heitman by 2030, Nuveen by 2040, and Brookfield Properties by 2050. Overall, that seems like a win-win in the end. Commercial real estate properties will be built to be more eco-friendly and investors will continue to profit. What’s not to like?

    Industry executives, primarily, in the CRE property construction industry have been frustrated by increased scrutiny. This seems to be common in amongst senior executives, for the most part, and especially in an industry like construction. Anytime there’s increased regulation, that always leads to greater frustration. More tensions regarding profit margins, income statements, investor reports. Increased regulation almost always results in greater costs for corporations. What does that result in, in turn? Layoffs, a decrease in quality, a decrease in work/life balance, etc. Another way to look at it is when executives become worse off, employees under them are sure to suffer too. The same is true in the CRE market, both for companies on the demand and supply side.

    What Will Happen to the “Other” 40%?

    What about the other 40%; the investors who haven’t considered ESG as part of their investment strategy. Perhaps they don’t care about climate change, or they don’t believe factoring in ESG is a winning investment position. Either way, 40% of a group is still an extremely significant number. It’s not like those 40% can be forgotten or neglected. It’s basically the same situation as the other side of the coin: real estate investment firms will have to carry products that cater to ESG negligent investors too. This could include (amongst other things) REITs that hedge against heavily ESG driven CRE investment properties.

    What’s The Ultimate Outcome?

    Investors and investment firms that nail down the perfect balance of ESG conscious investments will prosper. Ultimately, with names in the CRE space like Heitman, Nuveen, and Brookfield Properties all committing to net-zero carbon emissions, you can expect “greener” CRE properties to be built in the future. That’s surely a win-win for everyone, political agenda, or affiliation notwithstanding. For investors, it means being more mindful of the ESG impact of a given CRE construction project. For example, if you’re in a REIG, or even more importantly as an individual investor, much like the 60% of current CRE investors who factored ESG into their CRE investment portfolio, you must do the same. With a REIG, you benefit from economies of scale where investors can collaboratively think of the best long-term approach. When you’re on your own, you must be certain you’re cognizant of all variables that may cause you to potentially get into the red on an investment. The research from this article shows that for CRE specifically, ESG will be included in prospective long-term plans.

    Be sure to take note!

  • The Three Different Property Categories in Real Estate Investing

    One of the more common myths about real estate investing is that for the average investor, it’s largely lopsided in the way potential investors view their options in the real estate market. While real estate is the world’s largest asset class, most novice investors, who make up the majority of the real estate investing class, largely favor investing in the residential real estate segment. In other words, they do not fully appreciate multiple real estate investment categories.

    “One of the questions that generally first arises is: Exactly what sorts of property can be invested in? Is real estate investment just about flipping houses?”

    – Topouzis & Associates, P.C., 2022

    No, it’s not. Real estate investment is about a lot more than merely “flipping houses”. Real estate investment, in today’s day and age, is about portfolio diversification, hedging risk, purchasing REITs, leasing several adjoined units and becoming the Airbnb property manager, etc. There are plenty of ways real estate investors can earn a positive ROI outside of “buying low, selling high”. Historically and still commonly today, real estate investing has been segregated into three primary categories.

    1. Residential Real Estate

    Flipping houses is undoubtedly considered to be under the residential real estate umbrella. However, there is far more to it than that. Other types of property included in this category are condos, townhouses, and free-standing homes (Topouzis & Associates, P.C., 2022). Fundamentally, this is where people want to live, rather than work. Here’s an undoubtably interesting fact for real estate investors. If you have a rental property extend beyond four units in size – which causes it to be considered apartments – at which point the property becomes classified as Commercial Real Estate (CRE).

    2. Commercial Real Estate (CRE)

    In essence, this is the type of property where businesses are located. These locations are generally in large metropolitan areas, or places where potential customers can frequent. Commercial Real Estate (CRE), up until COVID at bare minimum, has seen a rapid acceleration of investment. Furthermore, multifamily residential units that have 4 plus units are considered in the CRE sub-sector of real estate investing. When you factor in alternative, more complex ways investors get into the CRE market (PropTech, REIGs, REITs, etc.), you’ll notice there is a tremendous amount of room to make a profit.

    3. Industrial Real Estate

    This class of real estate can be described as the kind of property where industrial “behind the scenes” elements of business get done. These locations are usually not “open” to customers in the conventional sense. Though generally there’s no prohibition against the occasional customer visitation. This third and final category of real estate investment includes areas such as warehouses, plants, factories, and shipment facilities.

    It’s critical to understand that each category will have a different investing approach. As an example, at times the residential real estate market was doing well, the CRE market plummeted. Novice real estate investors are best starting off here, at the first point of understanding the three different categories. Which category do you want to invest in? Why? Have you thought about the alternatives? Make sure you not only understand what real estate class is for you, but make sure you review the broad array of financial instruments available in each of those categories.

  • Four Major Valuation Methods Explained: Commercial Real Estate (CRE)

    From the perspective of investors, coming up with an accurate property valuation is the most significant factor in making investment decisions. Commercial real estate (CRE) investment has become increasingly popular in the past few decades. That’s because it’s viewed as an excellent vehicle for corporate and public wealth investors to achieve stable returns.

    In this post, we’ll look at four primary valuation methods investors use when looking at CRE proposals. It should be no surprise that technology deeply impacts a potential CRE investment valuation. It’s truly astounding how powerful software solutions can support the consistency, transparency, and standardization across the valuation industry.

    Cost Approach

    The cost approach involves estimating a rough total budget for how much the structure would cost to build from scratch. The cost approach accounts for the original value of the land, plus the cost to build the structure from the ground up. Investors typically look at this approach to see if it’s financially more profitable to develop a new property, versus buying an existing one. The cost approach is comprised of two major methods:

    • Reproduction Method – Costs of rebuilding an exact replica of the existing structure, using the same materials, construction methods, etc.
    • Replacement Method – Costs of rebuilding a new structure with brand new materials, construction methods, designs, etc.

    This logic is generally sound. However, it’s critical to note this method does not account for additional effort of development and construction involved in building a property from the ground up. Similarly, it does not account for the long-term cash flow of a given CRE project.

    Sales Comparison Approach

    Comparisons between key market factors are one of the most important inputs to any valuation method. Furthermore, sales comparisons are usually the source of information, such as cost of reproduction, current market capitalization rate, loan-to-value ratios, and others (Atlus Group). Prospective buyers use this approach to compare current CRE listings to recently sold projects. Though this list isn’t exhaustive, it includes major components of the sales comparison approach:

    • Price per square foot
    • Capitalization rate
    • Price per unit (multifamily CRE)
    • Price per key (hospitality CRE)
    • Physical condition
    • Location
    • Tenant profiles (income, credit quality, cash flow stability, etc.)
    • Income (financial statements)

    The closer in similarity a prospective CRE property is to a comparable sale – especially a recent one – referencing the above components, the more effective this approach tends to be. Finally, once the quantitative characteristics of the perspective CRE property are compared, there is a qualitative analysis to ensure any more or less favorable attributes are accounted for. These adjustments are an essential precaution, if using this valuation method for CRE purchases.

    One notable downside to this method is a lack of analysis of any long-term cash flows or property valuation.

    Capitalization Rate Approach (Income Capitalization)

    The “cap rate” approach is one of the most popular methods of property valuation. It’s very frequently used by analysts in both the lending world and intended acquisitions (Atlus Group). When you hear real estate professionals mention what a property “traded at”, they’re almost always citing either the cap rate, or the price per square foot, a property sold for.

    The formula for calculating cap rate is simple. It’s equal to the net operating income (NOI) of the property, divided by the capitalization rate. The outcome represents the ownership’s approximate value of the property, based on the first year’s expected cash flow.

    Like the Sales Comparison Approach, this tool is most valuable to estimate the current value of CRE properties. Furthermore, it’s even more useful if the property has relatively stable and easily predictable cash flow. New, complex projects that have essentially zero NOI are not good candidates for this valuation approach. In such circumstances, investors are much more likely to turn to the Discounted Cash Flow Approach.

    Discounted Cash Flow Approach

    While the three previously detailed CRE valuation methods are undoubtably useful under certain conditions, they share a major drawback. Each of first three valuation methods estimate the value of a CRE property at a specific point in time. This is in fact a major drawback for real estate investors, who are rarely investing primarily for short-term gains.

    Suppose an example of a long-term, direct real estate investor, looking to maximize their return of a 10-year period. The below formula, taken from Investopedia shows the common formula for the Discounted Cash Flow (DCF) approach.

    Source: Sabrina Jiang, Investopedia (2021)

    Investors utilize this method to factor in both the delta of the initial buying price and the value of the property after ten years, in addition to the net present value (NPV) of any cash flows that come in from owning that property over 10 years. This gives real estate investors a great formula to input prognostications, then make transactions based on those forecasts.

    Reverting to the drawbacks of point-in-time valuations, firstly, it’s critical to understand fundamental psychology real estate investors utilize. Typically, real estate investors have a longer-term vision, especially compared to investors who purchase various securities. This makes a point-in-time valuation much less relevant, since in the long-run real estate investors are not just looking at an easily predictably present value. As we saw in 2008 most famously and during the COVID-19 pandemic most recently, real estate prices can tank from unrelated market activities, political changes, or even a completely unexpected global health pandemic (Altus Group).

    Conclusion

    Long-term volatility concerns necessitate real estate investors to rely on more than increases in value over time. This is a primary explanation why investors generally rely on the cash flow, plus a final value increase. If an investor holds a property for ten years from purchase to sale, as an example, the overall return will be a combination of cash flow from all ten years of ownership, plus any difference between the initial purchase price and the ultimate sale price.

    The cost, sales comparison, and capitalization rate approaches all fail to account for both potential changes in the cash flow, or value of the property, over the investment hold period. Hypothetically, if an investor knows that in year three of the hold period, a major tenant is going to vacate the property and cause a significant decrease in the property’s cash flow for the period, this clearly negatively impacts the overall return the investor attains. The only valuation method that takes into consideration time value of money and captures the future performance of the property is the DCF method.

    The DCF method predicts future cash flows over an estimated property hold period. This includes both annual cash flow and profit at the time of sale. Many practitioners found that attempting to accurately predict revenue, expenses, and the future value of the property at the time of sale, is actually quite difficult. It essentially forces them forces them to think deeply and more critically. Long-term risk factors, management, quality of tenants, and trends in the real estate market suddenly appear on their immediate radar.

    While not perfect (valuation models are not a crystal ball), the DCF method is generally preferred by real estate investors. Bluntly, the DCF approach best matches the reality of the investment, compared to the others discussed above.

    The Closing Argument to Real Estate Investors (Primarily CRE Investors)

    Selecting the best-fit valuation method is akin to choosing the right tool for a homeowner’s repair project. Most of the decision is decided on a case-by-case basis, based on the best information available. With the varying subjective methods and information, asset appraisal in the world of commercial is part formula, part art form.

    In practicality, most appraisers don’t limit themselves to one method, instead taking an average of two or more methods. It’s hardly surprising appraisers have toned down their aggressive approach, especially compared to nearly 15 years ago. After the catastrophic downward spiral of 2008, the more analysis real estate investment projects undergo, the better. To build on the methods discussed, a well-known method rapidly gaining increasing popularity is called the stress test. Perhaps this test is more commonly referenced in the investment banking sector, namely to monitor volatility ratios of aggressive investment banks who also hold client checking and other deposit accounts, to ensure we don’t need to worry about anymore “bank runs”, but nonetheless the same logic applies to the real estate sector and it’s played an indispensable component to accurate real estate valuations. 

    If you take nothing else away from this article, use the DCF Method whenever possible. Especially in today’s ever-changing real estate market, periodic cash flows are a must to have a successful, long-term real estate holding. As with any other investment, do your due diligence, ensure you have the right team around you, and take calculated, well-thought risks. Good luck to all continuing to navigate the post COVID-19 real estate landmine!