Tag: real estate

  • Four Major Valuation Methods Explained: Commercial Real Estate (CRE)

    From the perspective of investors, coming up with an accurate property valuation is the most significant factor in making investment decisions. Commercial real estate (CRE) investment has become increasingly popular in the past few decades. That’s because it’s viewed as an excellent vehicle for corporate and public wealth investors to achieve stable returns.

    In this post, we’ll look at four primary valuation methods investors use when looking at CRE proposals. It should be no surprise that technology deeply impacts a potential CRE investment valuation. It’s truly astounding how powerful software solutions can support the consistency, transparency, and standardization across the valuation industry.

    Cost Approach

    The cost approach involves estimating a rough total budget for how much the structure would cost to build from scratch. The cost approach accounts for the original value of the land, plus the cost to build the structure from the ground up. Investors typically look at this approach to see if it’s financially more profitable to develop a new property, versus buying an existing one. The cost approach is comprised of two major methods:

    • Reproduction Method – Costs of rebuilding an exact replica of the existing structure, using the same materials, construction methods, etc.
    • Replacement Method – Costs of rebuilding a new structure with brand new materials, construction methods, designs, etc.

    This logic is generally sound. However, it’s critical to note this method does not account for additional effort of development and construction involved in building a property from the ground up. Similarly, it does not account for the long-term cash flow of a given CRE project.

    Sales Comparison Approach

    Comparisons between key market factors are one of the most important inputs to any valuation method. Furthermore, sales comparisons are usually the source of information, such as cost of reproduction, current market capitalization rate, loan-to-value ratios, and others (Atlus Group). Prospective buyers use this approach to compare current CRE listings to recently sold projects. Though this list isn’t exhaustive, it includes major components of the sales comparison approach:

    • Price per square foot
    • Capitalization rate
    • Price per unit (multifamily CRE)
    • Price per key (hospitality CRE)
    • Physical condition
    • Location
    • Tenant profiles (income, credit quality, cash flow stability, etc.)
    • Income (financial statements)

    The closer in similarity a prospective CRE property is to a comparable sale – especially a recent one – referencing the above components, the more effective this approach tends to be. Finally, once the quantitative characteristics of the perspective CRE property are compared, there is a qualitative analysis to ensure any more or less favorable attributes are accounted for. These adjustments are an essential precaution, if using this valuation method for CRE purchases.

    One notable downside to this method is a lack of analysis of any long-term cash flows or property valuation.

    Capitalization Rate Approach (Income Capitalization)

    The “cap rate” approach is one of the most popular methods of property valuation. It’s very frequently used by analysts in both the lending world and intended acquisitions (Atlus Group). When you hear real estate professionals mention what a property “traded at”, they’re almost always citing either the cap rate, or the price per square foot, a property sold for.

    The formula for calculating cap rate is simple. It’s equal to the net operating income (NOI) of the property, divided by the capitalization rate. The outcome represents the ownership’s approximate value of the property, based on the first year’s expected cash flow.

    Like the Sales Comparison Approach, this tool is most valuable to estimate the current value of CRE properties. Furthermore, it’s even more useful if the property has relatively stable and easily predictable cash flow. New, complex projects that have essentially zero NOI are not good candidates for this valuation approach. In such circumstances, investors are much more likely to turn to the Discounted Cash Flow Approach.

    Discounted Cash Flow Approach

    While the three previously detailed CRE valuation methods are undoubtably useful under certain conditions, they share a major drawback. Each of first three valuation methods estimate the value of a CRE property at a specific point in time. This is in fact a major drawback for real estate investors, who are rarely investing primarily for short-term gains.

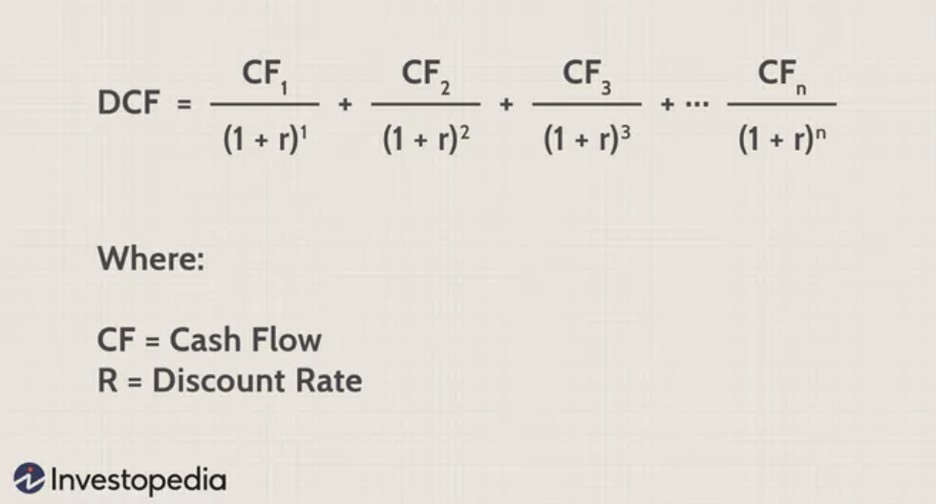
    Suppose an example of a long-term, direct real estate investor, looking to maximize their return of a 10-year period. The below formula, taken from Investopedia shows the common formula for the Discounted Cash Flow (DCF) approach.
    Source: Sabrina Jiang, Investopedia (2021)

    Investors utilize this method to factor in both the delta of the initial buying price and the value of the property after ten years, in addition to the net present value (NPV) of any cash flows that come in from owning that property over 10 years. This gives real estate investors a great formula to input prognostications, then make transactions based on those forecasts.

    Reverting to the drawbacks of point-in-time valuations, firstly, it’s critical to understand fundamental psychology real estate investors utilize. Typically, real estate investors have a longer-term vision, especially compared to investors who purchase various securities. This makes a point-in-time valuation much less relevant, since in the long-run real estate investors are not just looking at an easily predictably present value. As we saw in 2008 most famously and during the COVID-19 pandemic most recently, real estate prices can tank from unrelated market activities, political changes, or even a completely unexpected global health pandemic (Altus Group).

    Conclusion

    Long-term volatility concerns necessitate real estate investors to rely on more than increases in value over time. This is a primary explanation why investors generally rely on the cash flow, plus a final value increase. If an investor holds a property for ten years from purchase to sale, as an example, the overall return will be a combination of cash flow from all ten years of ownership, plus any difference between the initial purchase price and the ultimate sale price.

    The cost, sales comparison, and capitalization rate approaches all fail to account for both potential changes in the cash flow, or value of the property, over the investment hold period. Hypothetically, if an investor knows that in year three of the hold period, a major tenant is going to vacate the property and cause a significant decrease in the property’s cash flow for the period, this clearly negatively impacts the overall return the investor attains. The only valuation method that takes into consideration time value of money and captures the future performance of the property is the DCF method.

    The DCF method predicts future cash flows over an estimated property hold period. This includes both annual cash flow and profit at the time of sale. Many practitioners found that attempting to accurately predict revenue, expenses, and the future value of the property at the time of sale, is actually quite difficult. It essentially forces them forces them to think deeply and more critically. Long-term risk factors, management, quality of tenants, and trends in the real estate market suddenly appear on their immediate radar.

    While not perfect (valuation models are not a crystal ball), the DCF method is generally preferred by real estate investors. Bluntly, the DCF approach best matches the reality of the investment, compared to the others discussed above.

    The Closing Argument to Real Estate Investors (Primarily CRE Investors)

    Selecting the best-fit valuation method is akin to choosing the right tool for a homeowner’s repair project. Most of the decision is decided on a case-by-case basis, based on the best information available. With the varying subjective methods and information, asset appraisal in the world of commercial is part formula, part art form.

    In practicality, most appraisers don’t limit themselves to one method, instead taking an average of two or more methods. It’s hardly surprising appraisers have toned down their aggressive approach, especially compared to nearly 15 years ago. After the catastrophic downward spiral of 2008, the more analysis real estate investment projects undergo, the better. To build on the methods discussed, a well-known method rapidly gaining increasing popularity is called the stress test. Perhaps this test is more commonly referenced in the investment banking sector, namely to monitor volatility ratios of aggressive investment banks who also hold client checking and other deposit accounts, to ensure we don’t need to worry about anymore “bank runs”, but nonetheless the same logic applies to the real estate sector and it’s played an indispensable component to accurate real estate valuations. 

    If you take nothing else away from this article, use the DCF Method whenever possible. Especially in today’s ever-changing real estate market, periodic cash flows are a must to have a successful, long-term real estate holding. As with any other investment, do your due diligence, ensure you have the right team around you, and take calculated, well-thought risks. Good luck to all continuing to navigate the post COVID-19 real estate landmine!
  • What Happened to the Cryptocurrency Market on Black Friday?

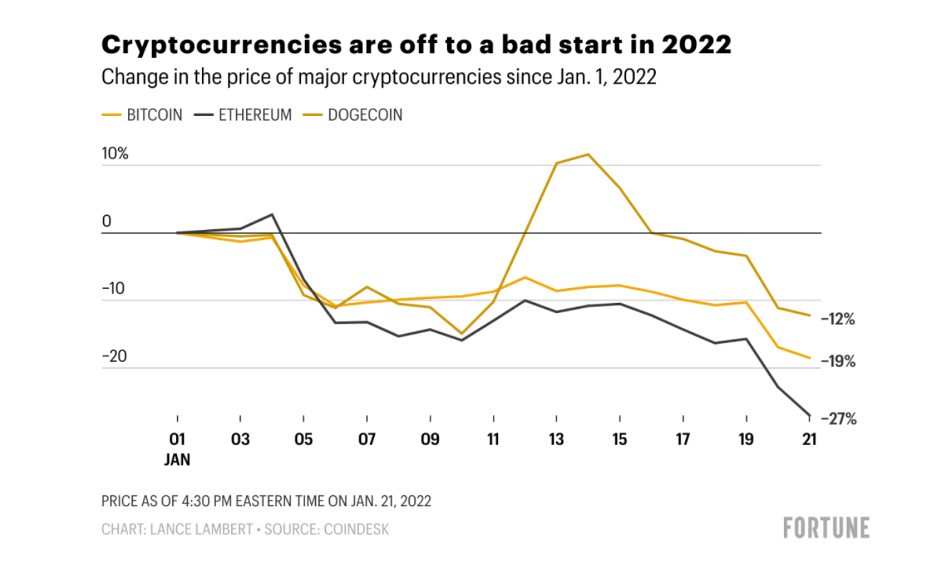
    On a Friday that surely won’t be forgotten anytime soon, on January 21st, 2022, according to CoinMarketCap, cryptocurrencies lost $205 billion in combined market capitalization. Bitcoin was trading at $38,440 as of 10AM Eastern Time on the day many are already calling “Black Friday”. This represents a 16.6% year-to-date drop for the most widely recognized cryptocurrency (Morris, Fortune). Furthermore, Bitcoin has already successfully erased 75% of their gains from 2021 and we’re less than a month into 2022.

    Additional noteworthy cryptocurrencies that suffered substantial setbacks were Ethereum, Solana, and Cardano. Ethereum is especially relevant here, as they received a monumental endorsement from Goldman Sachs in mid-2021. It plummeted 13.5% on Black Friday (-24% YTD), while Solana crashed 16% the same day (-30% YTD), and Cardano dropped 15% (Morris, Fortune). Cardano is also unique since their early gains make their current -8.5% YTD slip seem almost unscathed by comparison.

    Fortune

    Dodgecoin and Shiba Inu, classified as “meme coins”, weren’t exempt from the carnage either, falling 10% and 13%, respectively (Shrivastava, Yahoo Finance). According to CoinMarketCap, judging by overall market cap, they are by far the two largest meme coins. With that, let’s dig into the question investors around the world are actively pondering; what happened?

    Russia’s Central Bank Proposed a Cryptocurrency Ban

    Let’s start with the most obvious. On Black Friday, Reuters reported Russia, one of the world’s largest economies the third-largest Bitcoin miner in the world, proposed banning the use and mining of cryptocurrencies via their central bank. This is eerily similar to a move China pulled at the end of May 2021. We similarly witnessed Bitcoin and other major crypto’s suffer short-term dips, while quickly rebounding in the immediate weeks that followed.

    Russia’s central bank argued cryptocurrencies pose a substantial threat to the country’s financial stability. Additionally, they highlighted reasons pertaining to citizens’ wellbeing and its monetary policy sovereignty (Reuters). Ultimately, Russia’s central bank didn’t mince words, concluding with:

    “The best solution is to introduce a ban on cryptocurrency mining in Russia”

    -The Central Bank of Russian Federation (CBR)

    What’s lacking coverage right now is Russia has been arguing against cryptocurrency adoption for years. Russia’s been extremely vocal in raising concerns about the ease of cryptocurrency markets being used for money laundering and even financing global terrorism. It wasn’t until 2020 that they were given legal status, despite still being banned as a means of payment.

    Specific to events that unfolded on Black Friday, Russia’s central bank focused heavily on the long-term stability of cryptocurrencies. To be blunt, it tore them apart. The central bank determined their rapid growth was reflective of potentially perilous instability. Essentially, the central bank issued stern warnings of the cryptocurrency market being one enormous bubble. They went so far as to indicate cryptocurrencies carried similar characteristics to a financial pyramid.

    Large Market Liquidations Led by Bitcoin

    As one would expect, Black Friday was one of the highest ever single-day cryptocurrency liquidations. The significance of losing a combined $205 billion in market capitalization over a 24-hour period cannot be underscored. Leading that effort was Bitcoin, with Ethereum not far behind. The two lost over $281 billion and $207 billion in 24 hours, respectively.

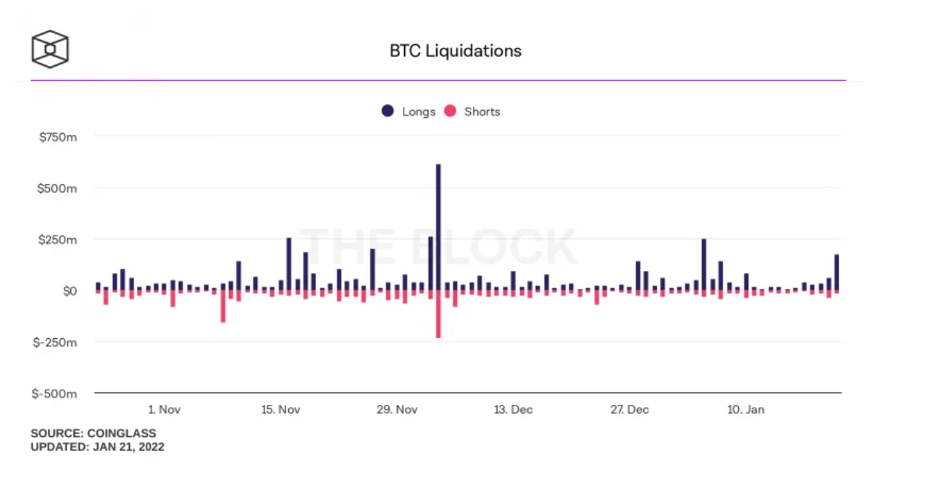
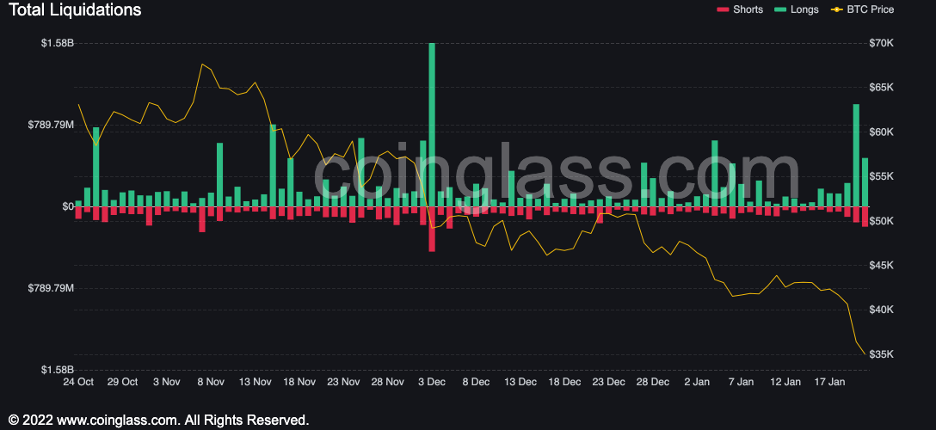
    The below chart, derived from CoinGlass Liquidation Data, does an excellent job in illustrating how Bitcoin’s price is impacted by investors taking a short position on crypto’s. As investors begin to show skepticism, it appears Bitcoin (BTC) begins to snowball downwards at an increasing rate.

    CoinGlass

    As the largest and most well-known cryptocurrency, historically Bitcoin’s performance dictates the overall crypto market trend. The same proved to be true on Black Friday.

    CoinGlass/Yahoo Finance

    Wall Street’s Weak Overall Weekly Performance

    Looking to recent history again, the US stock market performance has had a direct relationship with the crypto market’s performance. Before Black Friday, the S&P 500 Index (SPX) dropped nearly 4% over the course of 72 hours (Shrivastava, Yahoo Finance). When this was covered in real-time by Yahoo Finance, MacroAxis’ model had a maximum correlation of 0.59 between BTC and SPX. This is considered a significant correlation. The macroeconomic models from MacroAxis now show an existing correlation as high as 0.64, a stunning daily increase.

    While Russia’s central bank is undeniably the primary catalyst, Bitcoin’s rapid liquidation created an expected snowball effect. That made for terrible timing for historically safe, reliable US stock market investments to have a noticeably subpar week. Many investors, who were already feeling the pressure of safer investments in their portfolio losing value, were put in an even more precarious situation with their more speculative investments nosediving, causing many to quickly liquidate before further damage was done.

    Unsurprisingly, what’s next for Bitcoin and the cryptocurrency market is continuing to be widely debated. Multiple highly credible analysts and institutions remain firmly bullish, claiming Bitcoin will surpass $100,000. While a very wide network of high-net-worth individuals and financial giants still backing Bitcoin and crypto’s exists, it’s hard to imagine we won’t see another rebound yet again.

  • What Happened to the Cryptocurrency Market on Black Friday?

    On a Friday that surely won’t be forgotten anytime soon, on January 21st, 2022, according to CoinMarketCap, cryptocurrencies lost $205 billion in combined market capitalization. Bitcoin was trading at $38,440 as of 10AM Eastern Time on the day many are already calling “Black Friday”. This represents a 16.6% year-to-date drop for the most widely recognized cryptocurrency (Morris, Fortune). Furthermore, Bitcoin has already successfully erased 75% of their gains from 2021 and we’re less than a month into 2022.

    Additional noteworthy cryptocurrencies that suffered substantial setbacks were Ethereum, Solana, and Cardano. Ethereum is especially relevant here, as they received a monumental endorsement from Goldman Sachs in mid-2021. It plummeted 13.5% on Black Friday (-24% YTD), while Solana crashed 16% the same day (-30% YTD), and Cardano dropped 15% (Morris, Fortune). Cardano is also unique since their early gains make their current -8.5% YTD slip seem almost unscathed by comparison.

    Fortune

    Dodgecoin and Shiba Inu, classified as “meme coins”, weren’t exempt from the carnage either, falling 10% and 13%, respectively (Shrivastava, Yahoo Finance). According to CoinMarketCap, judging by overall market cap, they are by far the two largest meme coins. With that, let’s dig into the question investors around the world are actively pondering; what happened?

    Russia’s Central Bank Proposed a Cryptocurrency Ban

    Let’s start with the most obvious. On Black Friday, Reuters reported Russia, one of the world’s largest economies the third-largest Bitcoin miner in the world, proposed banning the use and mining of cryptocurrencies via their central bank. This is eerily similar to a move China pulled at the end of May 2021. We similarly witnessed Bitcoin and other major crypto’s suffer short-term dips, while quickly rebounding in the immediate weeks that followed.

    Russia’s central bank argued cryptocurrencies pose a substantial threat to the country’s financial stability. Additionally, they highlighted reasons pertaining to citizens’ wellbeing and its monetary policy sovereignty (Reuters). Ultimately, Russia’s central bank didn’t mince words, concluding with:

    “The best solution is to introduce a ban on cryptocurrency mining in Russia”

    -The Central Bank of Russian Federation (CBR)

    What’s lacking coverage right now is Russia has been arguing against cryptocurrency adoption for years. Russia’s been extremely vocal in raising concerns about the ease of cryptocurrency markets being used for money laundering and even financing global terrorism. It wasn’t until 2020 that they were given legal status, despite still being banned as a means of payment.

    Specific to events that unfolded on Black Friday, Russia’s central bank focused heavily on the long-term stability of cryptocurrencies. To be blunt, it tore them apart. The central bank determined their rapid growth was reflective of potentially perilous instability. Essentially, the central bank issued stern warnings of the cryptocurrency market being one enormous bubble. They went so far as to indicate cryptocurrencies carried similar characteristics to a financial pyramid.

    Large Market Liquidations Led by Bitcoin

    As one would expect, Black Friday was one of the highest ever single-day cryptocurrency liquidations. The significance of losing a combined $205 billion in market capitalization over a 24-hour period cannot be underscored. Leading that effort was Bitcoin, with Ethereum not far behind. The two lost over $281 billion and $207 billion in 24 hours, respectively.

    The below chart, derived from CoinGlass Liquidation Data, does an excellent job in illustrating how Bitcoin’s price is impacted by investors taking a short position on crypto’s. As investors begin to show skepticism, it appears Bitcoin (BTC) begins to snowball downwards at an increasing rate.

    CoinGlass

    As the largest and most well-known cryptocurrency, historically Bitcoin’s performance dictates the overall crypto market trend. The same proved to be true on Black Friday.

    CoinGlass/Yahoo Finance

    Wall Street’s Weak Overall Weekly Performance

    Looking to recent history again, the US stock market performance has had a direct relationship with the crypto market’s performance. Before Black Friday, the S&P 500 Index (SPX) dropped nearly 4% over the course of 72 hours (Shrivastava, Yahoo Finance). When this was covered in real-time by Yahoo Finance, MacroAxis’ model had a maximum correlation of 0.59 between BTC and SPX. This is considered a significant correlation. The macroeconomic models from MacroAxis now show an existing correlation as high as 0.64, a stunning daily increase.

    While Russia’s central bank is undeniably the primary catalyst, Bitcoin’s rapid liquidation created an expected snowball effect. That made for terrible timing for historically safe, reliable US stock market investments to have a noticeably subpar week. Many investors, who were already feeling the pressure of safer investments in their portfolio losing value, were put in an even more precarious situation with their more speculative investments nosediving, causing many to quickly liquidate before further damage was done.

    Unsurprisingly, what’s next for Bitcoin and the cryptocurrency market is continuing to be widely debated. Multiple highly credible analysts and institutions remain firmly bullish, claiming Bitcoin will surpass $100,000. While a very wide network of high-net-worth individuals and financial giants still backing Bitcoin and crypto’s exists, it’s hard to imagine we won’t see another rebound yet again.

  • New York City’s Housing Market Finishes Strong in 2021; Slowdown Expected in 2022?

    New York City’s residential real estate market closed 2021 with many arguing it had the strongest performance in three decades. By mid-October, Manhattan contract signings already surpassed the previous record, which was 12,520 in 2013 (UrbanDigs). With a little under two weeks left in 2021, closings reached 14,774 (Cavanaugh, TheRealDeal). Already, that’s more than double the 2020 total. Despite a rise in listings, that level of closings undoubtably depleted inventory. Are we heading towards a residential real estate market slowdown in NYC in 2022?

    UrbanDigs found that through December 5th, 2021, listings had exceeded the 2008-2018 average by 18%. Net new inventory – the number of monthly new listings, minus contracts signed and listings taken off-market – surprised many market experts. Astonishingly, buyers bought out the increased supply at an even faster pace. Net new inventory dropped below zero in 9 of 11 months during 2021, to negative 861 units (Cavanaugh, TheRealDeal).

    For buyers, prices have steadily risen in tandem. For the first time since 2015, listing discounts fell consistently throughout the year, even as buy-side competition increased. The luxury market, considered properties with a selling price of $4M and up, had the best year since 2014 (UrbanDigs). Buyers spent over $14B so far and with less than a couple weeks left in 2021, this represents a 19% increase over the previous record of the last three decades (UrbanDigs).

    Even with the residential housing market’s red hot 2021 performance, UrbanDigs co-founder John Walkup does not have nearly the same forecast for 2022.

    “Deal volume may slow through the holiday season, especially with fewer units coming to market”

    -John Walkup, Co-Founder of UrbanDigs

    He continued with stating he feels the next quarter could be noticeably slower than Q4 of 2021.

    “A slowdown in buy-side activity may cause inventory levels to rise, pressuring prices”

    -John Walkup, Co-Founder of UrbanDigs

    Furthermore, he predicted a “multi-quarter lull in 2022” for the luxury market.

    Walkup’s predictions for 2022 aren’t exactly universally accepted by known residential real estate experts. Jonathan Miller, President and CEO of Miller Samuel, had a different sentiment in his latest report for Douglas Elliman. Miller sees deals in Manhattan and Brooklyn continuing to outpace listings heading into 2022, as they have closing 2021. His report cautions real estate market participants not to be surprised if there isn’t as noticeable a slowdown in 2022.

     “Inventory is continuing to collapse, and that’s why we anticipate continued price growth into the new year”

    -Jonathan Miller, President & CEO of Miller Samuel

    According to the Wall Street Journal (WSJ), the Federal Reserve may hike interest rates as early as March 2022. Walkup believes this could “put an upper bound on condo prices, with luxury and new development prices falling first”. Simultaneously, Walkup assured the luxury lull will be “nothing too drastic”, estimating discounts maxing out at 5%.

    In a peculiar comparison, the WSJ noted that condos, as an asset class, lag behind the exceptional performance of the S&P 500 Index (Joe Wallace, Wall Street Journal). The S&P hit a 67th record high in the third to last week of 2021 (Alexander Osipovich, Wall Street Journal). Since the 2008 US financial collapse was largely related to assets and various securities in the housing market, it’s not surprising during that time, both the stock market and the value of real estate took a hit as a result (Cavanaugh, TheRealDeal). UrbanDigs found that since January 2008, the S&P increased 230%, while the price per square foot of a new Manhattan condo rose 68%.

    “The frothy activity observed in the NYC real estate market since the reopening has yet to translate into anything approaching the gains seen on the broader equity index”

    -John Walkup, Co-Founder of UrbanDigs

    While that may be true, you cannot live in an index, or any stock portfolio.

    Interest rates could also be a major influencing factor for foreign investment. Should the Fed raise rates, this would further strengthen the USD, which already surged to a 16-month high in November 2021 according to Barron’s. As a result, this places buyers with wealth in other countries in a disadvantageous position. So much so, Walkup pontificates, that this will dissuade foreigners from buying US real estate. Instead, Walkup believes they are likely to liquidate their current holdings. He goes on to state, “2022 could be the year of the foreign sellers”.

    In anticipation of the opposite, NYC brokers geared up for an influx of foreign buyers, ahead of travel bans being lifted from 33 countries in November 2021. The increasing prevalence of the Omicron variant is heavily pushing a slowdown on that effort. Nonetheless, a rebound of residential real estate in overseas markets suggests foreign investor fears may be receding.

    “On the whole, I think travel bans take a back seat to [profit and loss] statements. So whereas a lifted travel ban could certainly stimulate some activity, if NYC investment returns are viewed as less than optimal due to currency fluctuations or price volatility, foreign buyers will look elsewhere.”

    -John Walkup, Co-Founder of UrbanDigs

    On a more granular level, Walkup expects continued strong townhouse demand and a renewed interest in “fixer-uppers”. Compared to the 2008 – 2018 average, in 2021 average monthly sales volume of Manhattan townhouses rose by nearly 50 percent. Walkup feels the market will likely remain hot, as buyers continue pursuing space and privacy, inspired by the COVID-19 pandemic. He sees sales and prices continuing to rise, as more homes are snapped up, thereby depleting inventory.

    The demand for renovated units, however, could be ebbing (UrbanDigs). In October 2021, UrbanDigs released a report outlining a roughly 30 percent divide between prices of renovated units and “fixer-uppers”. The prevailing theory seems to be supply chain problems, with labor shortages and rising material costs being the main catalysts. This helps explain why a very substantial block of buyers opted to avoid properties requiring extensive renovation.

    Walkup said in 2022, the spread between renovated and unrenovated units has potential to narrow. Increasingly tightening supply compels buyers to opt for units in need of some TLC. All-in-all, especially considering NYC has remained a historically hot buyer’s market when it comes to residential real estate throughout all of 2021, it’s too early to truly predict what 2022 will bring. The Omicron variant’s spread throughout the US, as well as the world, will surely have an impact. Other external economic factors will continue to impact NYC’s housing market as well, as all eyes are on the Fed. If and when the Fed chooses to hike up rates, investors should expect the entire landscape of residential real estate in NYC, as well as the entire United States, to change.  

  • New York City’s Housing Market Finishes Strong in 2021; Slowdown Expected in 2022?

    New York City’s residential real estate market closed 2021 with many arguing it had the strongest performance in three decades. By mid-October, Manhattan contract signings already surpassed the previous record, which was 12,520 in 2013 (UrbanDigs). With a little under two weeks left in 2021, closings reached 14,774 (Cavanaugh, TheRealDeal). Already, that’s more than double the 2020 total. Despite a rise in listings, that level of closings undoubtably depleted inventory. Are we heading towards a residential real estate market slowdown in NYC in 2022?

    UrbanDigs found that through December 5th, 2021, listings had exceeded the 2008-2018 average by 18%. Net new inventory – the number of monthly new listings, minus contracts signed and listings taken off-market – surprised many market experts. Astonishingly, buyers bought out the increased supply at an even faster pace. Net new inventory dropped below zero in 9 of 11 months during 2021, to negative 861 units (Cavanaugh, TheRealDeal).

    For buyers, prices have steadily risen in tandem. For the first time since 2015, listing discounts fell consistently throughout the year, even as buy-side competition increased. The luxury market, considered properties with a selling price of $4M and up, had the best year since 2014 (UrbanDigs). Buyers spent over $14B so far and with less than a couple weeks left in 2021, this represents a 19% increase over the previous record of the last three decades (UrbanDigs).

    Even with the residential housing market’s red hot 2021 performance, UrbanDigs co-founder John Walkup does not have nearly the same forecast for 2022.

    “Deal volume may slow through the holiday season, especially with fewer units coming to market”

    -John Walkup, Co-Founder of UrbanDigs

    He continued with stating he feels the next quarter could be noticeably slower than Q4 of 2021.

    “A slowdown in buy-side activity may cause inventory levels to rise, pressuring prices”

    -John Walkup, Co-Founder of UrbanDigs

    Furthermore, he predicted a “multi-quarter lull in 2022” for the luxury market.

    Walkup’s predictions for 2022 aren’t exactly universally accepted by known residential real estate experts. Jonathan Miller, President and CEO of Miller Samuel, had a different sentiment in his latest report for Douglas Elliman. Miller sees deals in Manhattan and Brooklyn continuing to outpace listings heading into 2022, as they have closing 2021. His report cautions real estate market participants not to be surprised if there isn’t as noticeable a slowdown in 2022.

     “Inventory is continuing to collapse, and that’s why we anticipate continued price growth into the new year”

    -Jonathan Miller, President & CEO of Miller Samuel

    According to the Wall Street Journal (WSJ), the Federal Reserve may hike interest rates as early as March 2022. Walkup believes this could “put an upper bound on condo prices, with luxury and new development prices falling first”. Simultaneously, Walkup assured the luxury lull will be “nothing too drastic”, estimating discounts maxing out at 5%.

    In a peculiar comparison, the WSJ noted that condos, as an asset class, lag behind the exceptional performance of the S&P 500 Index (Joe Wallace, Wall Street Journal). The S&P hit a 67th record high in the third to last week of 2021 (Alexander Osipovich, Wall Street Journal). Since the 2008 US financial collapse was largely related to assets and various securities in the housing market, it’s not surprising during that time, both the stock market and the value of real estate took a hit as a result (Cavanaugh, TheRealDeal). UrbanDigs found that since January 2008, the S&P increased 230%, while the price per square foot of a new Manhattan condo rose 68%.

    “The frothy activity observed in the NYC real estate market since the reopening has yet to translate into anything approaching the gains seen on the broader equity index”

    -John Walkup, Co-Founder of UrbanDigs

    While that may be true, you cannot live in an index, or any stock portfolio.

    Interest rates could also be a major influencing factor for foreign investment. Should the Fed raise rates, this would further strengthen the USD, which already surged to a 16-month high in November 2021 according to Barron’s. As a result, this places buyers with wealth in other countries in a disadvantageous position. So much so, Walkup pontificates, that this will dissuade foreigners from buying US real estate. Instead, Walkup believes they are likely to liquidate their current holdings. He goes on to state, “2022 could be the year of the foreign sellers”.

    In anticipation of the opposite, NYC brokers geared up for an influx of foreign buyers, ahead of travel bans being lifted from 33 countries in November 2021. The increasing prevalence of the Omicron variant is heavily pushing a slowdown on that effort. Nonetheless, a rebound of residential real estate in overseas markets suggests foreign investor fears may be receding.

    “On the whole, I think travel bans take a back seat to [profit and loss] statements. So whereas a lifted travel ban could certainly stimulate some activity, if NYC investment returns are viewed as less than optimal due to currency fluctuations or price volatility, foreign buyers will look elsewhere.”

    -John Walkup, Co-Founder of UrbanDigs

    On a more granular level, Walkup expects continued strong townhouse demand and a renewed interest in “fixer-uppers”. Compared to the 2008 – 2018 average, in 2021 average monthly sales volume of Manhattan townhouses rose by nearly 50 percent. Walkup feels the market will likely remain hot, as buyers continue pursuing space and privacy, inspired by the COVID-19 pandemic. He sees sales and prices continuing to rise, as more homes are snapped up, thereby depleting inventory.

    The demand for renovated units, however, could be ebbing (UrbanDigs). In October 2021, UrbanDigs released a report outlining a roughly 30 percent divide between prices of renovated units and “fixer-uppers”. The prevailing theory seems to be supply chain problems, with labor shortages and rising material costs being the main catalysts. This helps explain why a very substantial block of buyers opted to avoid properties requiring extensive renovation.

    Walkup said in 2022, the spread between renovated and unrenovated units has potential to narrow. Increasingly tightening supply compels buyers to opt for units in need of some TLC. All-in-all, especially considering NYC has remained a historically hot buyer’s market when it comes to residential real estate throughout all of 2021, it’s too early to truly predict what 2022 will bring. The Omicron variant’s spread throughout the US, as well as the world, will surely have an impact. Other external economic factors will continue to impact NYC’s housing market as well, as all eyes are on the Fed. If and when the Fed chooses to hike up rates, investors should expect the entire landscape of residential real estate in NYC, as well as the entire United States, to change.  

  • Inflation is Rising, What About Housing Prices?

    Prices are rising, nearly universally. Inflation appears to be increasing at an increasing rate.

    Just about all credible economists are continuing to signal the inflation warning bells, with consumers continuing to pay more for everyday necessities, such as food and gasoline (Fox, CNBC). While we’re yet to see substantive, broad housing price increases, many believe we’re going to. 

    “With inflation rising so aggressively and the fact that people’s salaries and weekly income are not rising at the same rate, we end up with less discretionary money to spend each month”.

    -George Ratiu, Manager of Economic Research at Realtor.com

    Rising Home Prices

    To be clear, home prices have began to rise as well. The CPI (Consumer Price Index), which measures the cost of goods and services, shows that shelter [housing] rose 0.5% in October (Olick, CNBC). The CPI takes into account both rent prices and approximate prices homeowners would receive in hypothetical rent payments.

    Separately, it’s critical to note one month almost never gives any sort of definitive indication. However in August 2021, home prices were up 19.8%, a staggering increase (S&P CoreLogic Case-Shiller Indices). Nothing is definite yet, but renters would be wise to begin lowering their other budgetary expenditures. First and foremost, you will have less disposable income every month since you’re paying higher prices. However secondarily, according to Realtor.com, we’re also seeing mortgage rates climbing. Compared to a year ago, buyers are now spending on average $160 more a month on mortgage payments. Many experts believe those rates will continue to climb.

    “Generally as we see inflation go higher, we are going to see mortgage rates go higher”.

    -George Ratiu, Manager of Economic Research at Realtor.com

    Hedging Against Inflation

    Historically, real estate has largely been viewed as a hedge against inflation. With a mortgage, you lock in a fixed monthly payment for the term of the loan, which is definitely long-term. In turn, this shields you from sharp volatility in prices. Additionally, home values have traditionally at least kept up with inflation (Cox, CNBC).

    “Homes are expensive now … but for most people the comparison that is most important is how that cost of home ownership is going to compare to the cost of renting”.

    -Jeff Tucker, Senior Economist for Zillow

    Of course, rent is more unpredictable than locking in a fixed mortgage monthly payment. Over the course of your mortgage repayment, rent prices are almost certain to go up.

    “If wages are rising or if the cost of building materials and appliances and light bulbs and paint is rising, all of these to some extent will flow into the cost of maintaining and building rental homes”.

    -Jeff Tucker, Senior Economist for Zillow

    Furthermore, as seasoned investors are aware of, supply and demand often dictates housing market prices. According to CoreLogic, demand rose 10.2% nationally in September 2021 compared to where it was in 2020. On the flip side, a Realtor survey of 1,300 homeowners from fall 2021 found 26% plan to sell their home within the next 12 months. This figure is more than double the percentage of their same March 2021 survey. Overall, the consensus appears to be buying over renting, so long as you can afford it.

    “Historically, you are likely to get some of the best bargains of the year. I think 2022 has the promise of providing less competition, a lot more homes to choose from and, as a result, a lot more approachable prices”.

    -George Ratiu, Manager of Economic Research at Realtor.com

    At the same time, you may want to reconsider talking yourself into buying a home based on price alone.

    “The house is the place where your family is going to live every day”.

    -Jeff Tucker, Senior Economist for Zillow
  • What America’s Past in Real Estate Tells Us About the Future

    Some experts have argued that we’re at a torrid time in the future of the US real estate market. Others have argued NYC’s housing market has been roaring, with no sign of slowing down. With inflation continuing to cripple the value of the USD, prospective home buyers face pressure to invest in tangible assets. Many Americans are realizing a home is the most sensible shelter for their savings (Nguyen, Forbes).

    However, home supplies in coveted markets are scarce. Prices are ever-climbing and competition for homes is currently relentless. That’s generally where America’s market currently stands. The main question on the minds of homeowners and prospective buyers continues to be: “Where will markets go from here?”

    Of course, no one can say with certainty. Nevertheless, select lessons from America’s history provide a blueprint for home buying at this unique historical juncture.

    Lesson from the Great Depression

    Principally, you cannot separate the national economy from the nation’s housing markets. The American economy and the American housing market are akin to dominos aligned in the same row. On some occasions, the economy is the domino at the front of the row. Whereas there were other times – the subprime mortgage crisis (Great Recession, 2008) – the housing market is first in line.

    Arguably no time in American history better exhibits the inextricable link between national economic performance and the American people’s ability to both purchase, as well as hold onto, long-term houses. As the stock market crashed in 1929, bank runs quickly ensued, and mass unemployment followed closely behind. A staggering 273,000 Americans lost their homes in 1932, plus even more suffered foreclosure in the following year. Americans simply did not have the wherewithal to keep up with mortgage payments when crushing stagflation hit.

    Some things have not changed since the onset of the Great Depression. Americans today have become far more cognizant of a future possibility of widespread economic downturn. An economy in contraction means jobs lost, wages uncollected, and mortgage payments undelivered. Ultimately, this means foreclosures.

    Current Home-Buying Spree Continues

    Yet, even facing economic hardship triggered by the pandemic, America finds itself in the midst of a record home-buying spree. This may suggest any of the following three (Nguyen, Forbes):

    • A new segment of Americans (including former apartment-dwelling city residents) are injecting unprecedented capital into newfound housing markets.
    • Home buyers see houses as a sound investment, even as many expect the economy to take a turn for the worse.
    • The demand for homes in America is far greater than supply, increasing competition for each home.

    On one hand, the Great Depression is a necessary reminder for prospective home owners to not purchase beyond their means. However, many who lost their homes during the Great Depression certainly weren’t living lavishly. This is a critical takeaway – though one we must extract – from the hardships of the late 1920s and 1930s.

    Moreover, there are notable differences between 1930’s America and 2021, which bode favorably for today’s housing market. Incentive-laden tax policies, enacted since the Depression, made it more affordable to purchase homes and make the requisite mortgage payments. Today, Americans have a variety of investment options to mitigate risk. Additionally, federal policy has prevented bank failures from the magnitude witnessed during the Great Depression.

    Lesson from the GI Bill (1944)

    Concisely, cheap credit can set you up for life (Nguyen, Forbes). If you’ve been relishing your prevailing 3% interest rates, prepare for disappointment (by comparison).

    Not long after the Allied invasion of Normandy Beach, US President Franklin Roosevelt signed the GI Bill (1944). The was portrayed as a token of appreciation to a generation of young Americans, who risked their lives at war. Upon returning home, those GIs received government-backed loans that all but guaranteed homeownership, amongst other benefits. Banks the US government deemed a guarantor were overwhelmingly likely to approve a mortgage application.

    With access to such favorable loan conditions, veterans went on to purchase 20% of all homes built after the war. GIs took full, absolute advantage of the easy credit they undeniably earned.

    Fast forward to the present. While a government-guaranteed loan might sound ideal, you truly cannot complain about today’s prevailing 3% interest rates (Campisi, Forbes). To compare, interest rates topped 17% in 1982, then hovered around 10% for significant periods in the 1990s. That means two decades ago, you’d have to pay 8% for a home loan. Quite staggering compared to today’s housing market climate, to say the least.

    To reemphasize, the prime takeaway from the GI Bill, is that favorable credit should be pounced on, while it’s available. Historically, the sub-3% rate, which we’ve seen for the vast majority of 2021, is a statistical anomaly. Based on the frenzy of home buying we’ve witnessed, it seems that many Americans and foreign investors know their history. Perhaps much more than some casual real estate investors may think.

    Conclusion

    Seemingly, the two monumental American national economic events discussed provide opposing lessons for today’s prospective home buyer. The sudden, near-total crash of the Depression-era housing market reminds us the importance of consumer’s buying within their means. The GI Bill reinforces the importance of closing on a home, especially while lending terms are favorable. Upon extensive examination, these lessons can be very much complimentary in the future.

    As we’ve noted, today, Americans find themselves at a confounding point. Interest rates are very favorable; however, the economy is riddled with inflationary concerns and general uncertainty. It’s a time both reminiscent of GI Bill-era opportunity and Depression-era anxiety (Nguyen, Forbes).

    Of any lesson investors should takeaway, it’s this: you can embrace the benefits of comparatively cheap credit while remaining within your spending means. Be sure you don’t miss out on a prime real estate investment, while interest rates are so favorable. Stray away from overextending yourself to the point where you cannot keep up with future payments, should times get tough.

    For strategically sound real estate investing, you must look to the past to help predict the future. If nothing else, for guidance. That includes the better parts, but perhaps even more importantly for investors, the worse.  

  • What America’s Past in Real Estate Tells Us About the Future

    Some experts have argued that we’re at a torrid time in the future of the US real estate market. Others have argued NYC’s housing market has been roaring, with no sign of slowing down. With inflation continuing to cripple the value of the USD, prospective home buyers face pressure to invest in tangible assets. Many Americans are realizing a home is the most sensible shelter for their savings (Nguyen, Forbes).

    However, home supplies in coveted markets are scarce. Prices are ever-climbing and competition for homes is currently relentless. That’s generally where America’s market currently stands. The main question on the minds of homeowners and prospective buyers continues to be: “Where will markets go from here?”

    Of course, no one can say with certainty. Nevertheless, select lessons from America’s history provide a blueprint for home buying at this unique historical juncture.

    Lesson from the Great Depression

    Principally, you cannot separate the national economy from the nation’s housing markets. The American economy and the American housing market are akin to dominos aligned in the same row. On some occasions, the economy is the domino at the front of the row. Whereas there were other times – the subprime mortgage crisis (Great Recession, 2008) – the housing market is first in line.

    Arguably no time in American history better exhibits the inextricable link between national economic performance and the American people’s ability to both purchase, as well as hold onto, long-term houses. As the stock market crashed in 1929, bank runs quickly ensued, and mass unemployment followed closely behind. A staggering 273,000 Americans lost their homes in 1932, plus even more suffered foreclosure in the following year. Americans simply did not have the wherewithal to keep up with mortgage payments when crushing stagflation hit.

    Some things have not changed since the onset of the Great Depression. Americans today have become far more cognizant of a future possibility of widespread economic downturn. An economy in contraction means jobs lost, wages uncollected, and mortgage payments undelivered. Ultimately, this means foreclosures.

    Current Home-Buying Spree Continues

    Yet, even facing economic hardship triggered by the pandemic, America finds itself in the midst of a record home-buying spree. This may suggest any of the following three (Nguyen, Forbes):

    • A new segment of Americans (including former apartment-dwelling city residents) are injecting unprecedented capital into newfound housing markets.
    • Home buyers see houses as a sound investment, even as many expect the economy to take a turn for the worse.
    • The demand for homes in America is far greater than supply, increasing competition for each home.

    On one hand, the Great Depression is a necessary reminder for prospective home owners to not purchase beyond their means. However, many who lost their homes during the Great Depression certainly weren’t living lavishly. This is a critical takeaway – though one we must extract – from the hardships of the late 1920s and 1930s.

    Moreover, there are notable differences between 1930’s America and 2021, which bode favorably for today’s housing market. Incentive-laden tax policies, enacted since the Depression, made it more affordable to purchase homes and make the requisite mortgage payments. Today, Americans have a variety of investment options to mitigate risk. Additionally, federal policy has prevented bank failures from the magnitude witnessed during the Great Depression.

    Lesson from the GI Bill (1944)

    Concisely, cheap credit can set you up for life (Nguyen, Forbes). If you’ve been relishing your prevailing 3% interest rates, prepare for disappointment (by comparison).

    Not long after the Allied invasion of Normandy Beach, US President Franklin Roosevelt signed the GI Bill (1944). The was portrayed as a token of appreciation to a generation of young Americans, who risked their lives at war. Upon returning home, those GIs received government-backed loans that all but guaranteed homeownership, amongst other benefits. Banks the US government deemed a guarantor were overwhelmingly likely to approve a mortgage application.

    With access to such favorable loan conditions, veterans went on to purchase 20% of all homes built after the war. GIs took full, absolute advantage of the easy credit they undeniably earned.

    Fast forward to the present. While a government-guaranteed loan might sound ideal, you truly cannot complain about today’s prevailing 3% interest rates (Campisi, Forbes). To compare, interest rates topped 17% in 1982, then hovered around 10% for significant periods in the 1990s. That means two decades ago, you’d have to pay 8% for a home loan. Quite staggering compared to today’s housing market climate, to say the least.

    To reemphasize, the prime takeaway from the GI Bill, is that favorable credit should be pounced on, while it’s available. Historically, the sub-3% rate, which we’ve seen for the vast majority of 2021, is a statistical anomaly. Based on the frenzy of home buying we’ve witnessed, it seems that many Americans and foreign investors know their history. Perhaps much more than some casual real estate investors may think.

    Conclusion

    Seemingly, the two monumental American national economic events discussed provide opposing lessons for today’s prospective home buyer. The sudden, near-total crash of the Depression-era housing market reminds us the importance of consumer’s buying within their means. The GI Bill reinforces the importance of closing on a home, especially while lending terms are favorable. Upon extensive examination, these lessons can be very much complimentary in the future.

    As we’ve noted, today, Americans find themselves at a confounding point. Interest rates are very favorable; however, the economy is riddled with inflationary concerns and general uncertainty. It’s a time both reminiscent of GI Bill-era opportunity and Depression-era anxiety (Nguyen, Forbes).

    Of any lesson investors should takeaway, it’s this: you can embrace the benefits of comparatively cheap credit while remaining within your spending means. Be sure you don’t miss out on a prime real estate investment, while interest rates are so favorable. Stray away from overextending yourself to the point where you cannot keep up with future payments, should times get tough.

    For strategically sound real estate investing, you must look to the past to help predict the future. If nothing else, for guidance. That includes the better parts, but perhaps even more importantly for investors, the worse.  

  • NYC’s Real Estate Market: Roaring Housing Prices Show No Signs of Slowdown

    “The story that I’m seeing across the board: All segments are transacting. New York [real estate] is back, and people want to be here.”

    – Christopher Kromer, Brown Harris Stevens

    Statistically, that’s an excellent summation of New York City’s real estate market. While real estate was least of all financial asset classes hit by the COVID-19 pandemic, it’s not really “recovering”. Quite amazingly, it’s heating up. It has been for months now, but experts predict that was just a warm up (Singh, CNBC).

    “We’re coming off a record number of signed contracts in the second quarter, and what’s driving that is buyers are seeing value. They’re sensing opportunity, and there’s a real sense of hope for an economic boom in September when it opens up.”

    – Christopher Kromer, Brown Harris Stevens

    In other words, even reasonable rental prices are getting nearly impossible to find almost anywhere in New York City. The buyer’s market is a different story. As Kromer put it, “For the most part, if you’re buying today, it’s probably less expensive than it would have been three or four years ago”. For these purposes, suppose we break New York City’s real estate market into two distinct elements. The profit opportunity for cash buyers has been there and will continue to be there for a prolonged time. Conversely, the residential real estate market for renters, who are mostly living paycheck-to-paycheck, is a nightmare (Nasdaq).

    A Contradictory Study

    Although, a recent Douglas Elliman and Miller Samuel report appeared to somewhat contradict this philosophy. The report showed median resale prices for Manhattan apartments reached an all-time high in Q2 2021 (Douglas Elliman). Average sale prices rose 12% in the quarter (Douglas Elliman). They topped $1.9 million and there was also a 150% gain in sales during that same time period, compared to 2020. In Q2 of 2020, Manhattan apartment sales had their largest percentage decline in 30 years. Residents fled Manhattan during the COVID-19 pandemic, so brokers largely weren’t even able to show apartments to prospective buyers.

    Kromer had a response to the data presented by the Douglas Elliman and Miller Samuel report.

    “I think it’s probably tilted with a lot of high-end closings. The luxury market has been booming lately with a lot of discounts.”

    – Christopher Kromer, Brown Harris Stevens

    The recent activity in Manhattan’s luxury housing market still hasn’t wiped away the excess inventory created by COVID-19. In the luxury market, sellers are coming down on asking prices to meet buyers on their side. This in turn gives buyer’s even more buying power because they have options.

    “What’s driving this are more realistic sellers and softer prices. We still are at near-record levels of inventory. So, the sellers are going down to meet the buyers at their prices. The buyers have options.”

    – Christopher Kromer, Brown Harris Stevens

    Moving Beyond Manhattan

    Astoundingly, markets in the outer boroughs of New York, such as Brooklyn, showed far more resilience through the pandemic. This is again compared to the luxury, upscale housing market in Manhattan; a very significant geographic market difference.

    “People were looking for value, for space and less dense areas, and you did not see the discounts that you saw in Manhattan in the outer boroughs”.

    – Christopher Kromer, Brown Harris Stevens

    A few of Kromer’s own listings in Queens and Brooklyn recently sold above asking price, after receiving multiple offers. One two-bedroom co-op in Brooklyn even sold at roughly 8-9% above the price it sold at three years ago.

    “A single-family home in Queens was overwhelmed with interest. We had about 50 showings within the first week, with it selling for about 10% above the asking price”.

    – Christopher Kromer, Brown Harris Stevens

    In Conclusion

    Despite the study from Douglas Elliman and Miller Samuel, data shows NYC’s housing market is prospering. Housing rental prices on luxurious Manhattan properties are barely affordable. Rental prices outside the heart of New York are still steep and the availability of affordable housing is shrinking. This is nearly all attributed to the “buyer’s market” NYC real estate is clearly in the midst of. Prospective renters need to act fast to avoid losing out on any decent affordable housing in the five boroughs. Prices will only continue to increase, while availability will only continue to decrease.

  • How Real Estate Impacts the US Economy

    Real estate, commonly known as the largest asset class in the world, would intuitively play an integral role in the US economy. Residential real estate properties provide a vital pillar of the “American Dream”: private housing for families. Separately, they can also be the greatest source of wealth and savings for many Americans. Commercial real estate (CRE) – including apartment buildings – creates jobs and rented spaces for retail stores, offices, and manufacturing warehouses. Real estate business and investment provides a source of revenue for millions of Americans.

    In 2018, real estate construction contributed $1.15 trillion to the US national economy output (BEA.gov). That accounts for 6.2% of the US economy GDP over the same year, which is quite a significant proportion. For comparison’s sake, it’s more than the $1.13 trillion in 2017, however less than the 2006-peak of $1.19 trillion. Back in 2006, real estate construction was an even heftier 8.9% component of US GDP (Amadeo, The Balance).

    While there’s some politicization over whether these qualify as “good” jobs, real estate construction is obviously labor-intensive. It plays a major force in job creation. The decline in housing construction was undoubtedly a major contribution to the COVID-19 Recession’s high unemployment rate.

    The Ripple Effect in the US Economy of Real Estate

    Construction is the only part of real estate that’s directly calculated into US GDP (Amadeo, The Balance). Nonetheless, real estate affects many other areas of the US economy, which aren’t captured by US GDP metrics. As an example, a decline in real estate sales inevitably leads to a decline in real estate prices. This effect lowers the value of all homes, irrespective of whether owners are actively selling or not. Furthermore, this causes a reduction in the overall number of home equity loans available to owners. Ultimately, the market impact is reduced consumer spending, as more homeowner cash is tied up in housing projects.

    As many are aware, nearly 70% of the US economy is based on personal consumption (BEA.gov). Consequently, a reduction in consumer spending is directly linked to a downward spiral in the US economy. The downward spiral causality is easily witnessed. This macroeconomic phenomenon leads to further drops in employment, income, and consumer spending (Amadeo, The Balance). The primary concern about the US economy falling into a deep recession stems from concerns about Federal Reserve policy. The Federal Reserve received widespread accreditation for keeping rates very low throughout the COVID-19 pandemic. Many experts argue a further cut to interest rates are still necessary (Amadeo, The Balance). There is one positive takeaway regarding lower home prices. They lessen the chance of inflation.

    Real Estate and the 2008 US (Global) Economy Recession

    Of course, no better example exists of real estate’s impact on the US economy than the 2008 recession. While very few immediately realized it, falling home prices triggered the downturn and subsequent broad, ill effects. According to the National Association of Realtors (NAR), by July 2007, the median price of an existing single-family home in the US was down 4% since its peak in October 2005 (National Association of Realtors). Macroeconomists, risk analysts, credit analysts, and economists as a whole couldn’t reconcile how concerning this was. Clear definitions and numeric parameters of recession, bear market, and a stock market correction are well standardized. The same is still, not yet true for the housing market.

    For perspective and comparison, many likened it to the 24% decline during the Great Depression of 1929. Others compared it to the decline ranging from 22% to 40% in US, oil-producing areas in the early 1980s. Incorrectly using these as benchmarks, the 2008 housing “slump” could appear barely newsworthy. To the contrary, the crash quickly gained steam. Economic studies have shown that even fairly small declines between 10% and 15% are enough to eliminate the homeowner’s equity. We saw this occur in early 2007 within communities in Florida, Nevada, and Louisiana.

    Death by Derivatives

    Staggeringly, nearly half the loans issued between 2005 and 2007 were subprime. Of course, this means homebuyers are much more likely to default. Far worse for the national economy, banks used these loans to finance trillions of dollars of derivatives. Banks infamously packaged these loans into mortgage-backed securities. They peddled them as “safe” investments to pension funds, corporations, and retirees. Moreover, they were thought of as “insured” from default by a new insurance product called a credit default swap. The biggest issuer was American International Group, Inc. (AIG).

    Once borrowers defaulted, the mortgage-backed securities had very questionable value. A huge number of investors began to exercise their credit default swaps, such that AIG ran out of cash. They were ready to default themselves, until the Federal Reserve bailed them out.

    Investment banks with a large number of mortgage-backed securities on their books – most notably Bear Stearns and Lehman Brothers – were rejected by other banks. Without cash to continue operations, they ran to the Fed for help. The Fed wound up finding a buyer for Bear Sterns, but not the latter, Lehman. The bankruptcy of Lehman Brothers kicked off the 2008 financial crisis, officially.

    Are We on The Brink?

    Studies show investors are seriously questioning whether another real estate market crash will happen in the next two years. Housing prices are more or less stagnant, while the Fed is beginning to drop interest rates. This is indicative of a bubble and historically we know that bubbles burst.

    However, there are many structural differences to consider when evaluating today’s market with the housing market in 2005. Firstly, the volume of subprime loans makes up a smaller percentage of the mortgage market. Interestingly, however, these are growing under the “nonprime loans” name. In 2005, they contributed roughly 20% (Amadeo, The Balance). Additionally, banks have greatly increased lending standards. Investors, those who flip houses, have to provide between 20% to 45% of the cost of a home. Compared to during the subprime crisis, buyers needed to provide 20% or less.

    Most importantly, homeowners are not taking as much equity out of their homes. Home equity skyrocketed at $85 billion in 2006. Subsequently, it collapsed to less than $10 billion in 2010 and remained around that level until 2015. By 2017, it had only risen to $14 billion (Amadeo, The Balance). A major reason behind that is fewer people are filing for bankruptcy (Allen, Consumer Reports). In 2016, only 770,846 filed for bankruptcy; by comparison in 2010, only 1.5 million people did (Allen, Consumer Reports). Many economists, quite surprisingly, attribute this to “Obamacare”.

    The Bottom Line

    Concisely, we’re very unlikely to see anything close to what we witnessed in 2008 for a number of reasons. Primarily, structural changes in the economy – such as volatility ratio mandates for investment and retail banks – would prevent a widespread financial epidemic, even if the housing market were to suffer a significant downturn. Equally important to the housing market, mandates for homeowners and active real estate investors are more stringent. Finally, cost-cutting measures, such as the ACA, make it less likely for homeowners to default on mortgage payments.

    This is not even considering that while some reputable economists believe we may see prices decline in the next two years, we’ve yet to see it. In fact, as we continue to recover from COVID-19 economically, we’re seeing a housing market recovery. There’re multiple reasons we don’t need to worry about a repeat of 2008.